US inflation comes above expectations with core MoM coming in at 39 basis points, around 10 basis points above what was market consensus heading into the print. This leaves the YoY rate of change at 3.9%. The headline also surprised to the upside with YoY falling to a lower-than-expected 3.1% (2.9% exp., 3.4% prev.). Was this a signal proving that inflation is going to remain sticky or just a noise on the otherwise downward-sloping rate of inflation in the US? – Here is our take:
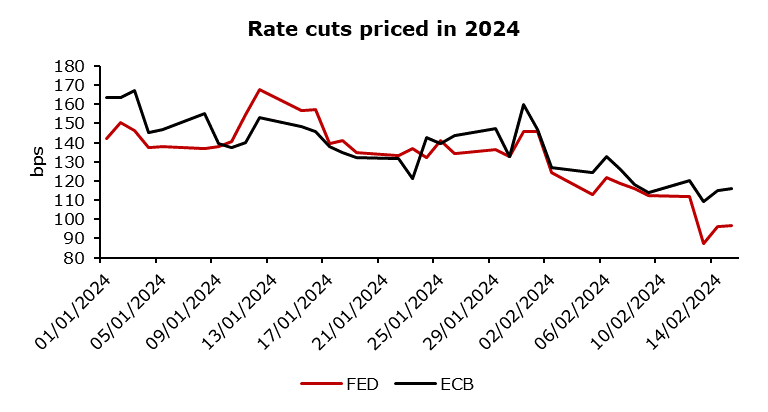
Data such as ISM Manufacturing Prices Paid and Nonfarm Payrolls came above expectations at the beginning of the month, prompting the market to dial down on rate cut expectations. Those two strong prints brought down the number of bps of cuts expected down to 113 from 145. A stronger-than-expected CPI print further simmered down rate cuts expectations to 87 bps, although that number has recovered a bit and is at 97 as we write this piece. That number is briskly approaching the median dot of 75 bps of rate cuts projected in the latest FOMC dot plot with unemployment at 3.7% and the Atlanta Fed nowcasting growth for Q1 at 3.4%.
Let’s go back to this CPI print and look at how some of the individual components have impacted the overall picture. Goods have fallen 32 bps, the third largest monthly decline on record after the pandemic ended, mostly driven by a 3.4% drop in used cars and truck prices. The unexpected anomaly was the shelter component with its main subcomponent, owner’s equivalent rent (OER) which ramped up to 0.6%, which could be an anomaly given that tenant’s rent measure rose at a much slower pace of 0.3%, which points to the fact that primary rents are continuing to decline. Services excluding energy and food rose by 0.7% driven by hotel accommodation (2.4%), airline tickets (1.4%), healthcare insurance (1.4%), car insurance (1.4%), most of which were probably affected by the rise in wages and the fact that lots of companies are usually modifying their prices in January with the possibility that they raised them a bit more than necessary as a buffer to shield them from potential cost pressure. Core services excluding housing or the so-called supercore CPI came at an astonishing 0.9% MoM (4.3% YoY) which is the highest print since April 2022. It is quite likely that recent updates to some of the weights in the CPI added a couple of bps to core inflation which should not impact core PCE as it uses different weighting, core goods have a higher weight and OER has a significantly lower weight in PCE than in CPI.
While a bit stronger core CPI brought a change from a softer trend that marked the prior few months, this print probably isn’t an indication of the beginning of a new trend, although it is likely to encourage the Fed to continue with the most recent communication emphasizing the wait and hold approach to see how the prices will develop before declaring victory over inflation. To conclude, the pass-through from the CPI data to the January PCE is likely to be mild. The focus now shifts to the PPI report on Friday, some of whose components directly enter the calculation for the PCE Price Index, the Fed’s preferred inflation measure.
Source: Bloomberg, InterCapital
By the end of January 2024, the Romanian CPI grew by 1.1% MoM, and 7.4% YoY.
According to the latest release by the Romanian National Institute of Statistics, the Romanian CPI growth accelerated to 7.4% YoY, growing for the 1st time after months of deceleration. On the monthly basis, the CPI growth was also noteworthy, at 1.1%. Of course, unlike the Eurozone member countries, Romania uses its own currency which allows more flexibility for its Central Bank, but also means that inflationary pressures can be stronger.
Romanian CPI (January 2020 – January 2024, %)
Source: Romanian National Institute of Statistics, InterCapital Research
Breaking this growth down into the components, on the MoM basis, prices in Services recorded an increase of 1.6%, prices in Food goods grew by 1.3%, while prices in Non-food goods increased by 0.7%. Meanwhile, on the YoY basis, prices of Services grew by 10.9%, prices of Non-food goods increased by 7.4%, while prices of Food goods grew by 5.6%. As we can see on both the MoM and YoY basis, prices across various categories are still growing, instead of being influenced by a single category. This is what is usually referred to as “sticky” inflation, and this type of inflation is usually harder to combat. The reason is the fact that the usual way of combating inflation, i.e. increasing interest rates and keeping them elevated to reduce demand does not influence different categories of products/services/sectors in the same manner.
The Harmonized Index of Consumer Prices (HICP) is yet to be published for Romania, but at the current inflation levels, it would place the country’s inflation close to the top, if not at the top of the YoY inflation growth.