As the largest brokerage house in Croatia and Slovenia, InterCapital deals with a broad range of clients (both institutional and retail) who utilise various trading strategies in orders to achieve an above average return. In order to achieve their goals some investors tend to incorporate shares and ETFs outside of the region into their portfolio. Globalization, technological development of trading platforms, freedom of capital movement and a number of other reasons have led to the investment perspectives of investors spreading to the whole World.
In order to present current investment trends of our clients in foreign markets we bring you an overview of our clients trading activity in August, with a focus on shares and ETFs traded abroad.
For starters, let us begin with our nearest market. By analysing the trading of our clients on the Ljubljana Stock Exchange, we can conclude that clients still prefer the so-called Blue chips in Slovenia whose business they are better acquainted with and can more easily guess the potential effects of a pandemic on their business. The most traded shares were Krka, Petrol, NLB and Zavarovalnica Triglav. This is not surprising given that these companies are the largest and most liquid issues at LJSE.
However, since we consider Ljubljana Stock Exchange as part of our domestic market, for the remaining part of this blog we will focus on stock exchanges in western Europe and the USA.
Most traded shares
Most traded ETFs
| wdt_ID | Most traded shares |
|---|---|
| 1 | Alpha Pro Tech |
| 2 | Gevo |
| 3 | Sorrento Therapeutics |
| 4 | United Airlines Holdings |
| 5 | Tesla |
| 6 | Eastman Kodak |
| 7 | Kornit Digital |
| 8 | Ayro |
| 9 | Inovio Pharmaceuticals |
| 10 | Amazon |
| wdt_ID | Most traded ETF | Underlying assets |
|---|---|---|
| 1 | Proshares UltraPro Short QQQ | Three times the inverse (-3x) of the daily performance of the Nasdaq-100 Index |
| 2 | L&G DAX Daily 2x Long | Twice the daily performance of the DAX Index |
| 3 | X ShortDAX x2 Daily Swap | Two times the inverse (-2x) of the daily performance of the DAX Index |
| 4 | Direxion dly S&P 500 bear 3x | Three times the inverse (-3x) of the daily performance of the S&P 500 Index |
| 5 | iShares Silver Trust | Silver |
| 6 | Vanguard S&P 500 | S&P 500 |
| 7 | iShares MSCI United Kingdom | MSCI United Kingdom Index. |
| 8 | Direxion dly S&P 500 bull 3x | Three times the daily performance of the S&P 500 Index |
| 9 | iShares MSCI Turkey | Broad-based index composed of Turkish equities. |
| 10 | SPDR Gold Shares | Gold bullion (USD) |
When looking at the shares mostly traded by our clients, it becomes obvious that the most interesting shares now are shares with a lot of volatility. At the top of the list comes Alpha Pro Tech, a global manufacturer of personal protective equipment including medical face masks, face shields, and infection control suits, to whom our clients have been showing a lot of interest for the past several months.
ETFs produce a mixed picture. As one can notice both long and short strategy ETFs are interchanging in the top 4 position on our top 10 traded list. Considering that we saw major foreign indices reach new peaks in August it might not be that surprising that investors have split thoughts on future, with some expecting a downward trend to emerge, while other expect the rise to continue.
To compare our clients’ investments with the global movement of capital, we present a list of the top 10 ETFs in August by amount of inflows and outflows.
The data on inflows, or outflows of cash from ETFs, is important because it indicates the interest of ETF managers in purchases, or sales of so-called Underlying (most commonly stocks, sometimes bonds or other instruments). ETFs with inflows buy additional underlying, while ETFs that have outflows of cash sell their underlying on the stock exchange.
Top 10 ETFs According to Inflow of Funds
| wdt_ID | ETF | Underlying asset | Inflow USDm |
|---|---|---|---|
| 1 | Invesco QQQ Trust | Nasdaq 100 | 2.269,27 |
| 2 | Vanguard Total Bond Market | Broad, market-value-weighted index of US dollar-denominated, investment-grade, taxable, fixed-income securities with maturities of at least one year. | 2.217,79 |
| 3 | iShares Core MSCI EAFE | Market-cap-weighted index of developed-market stocks in Europe, Australasia and the Far East, and excludes the US and Canada. | 2.181,88 |
| 4 | Vanguard Total Stock Market | Cap-weighted index that measures the investable US equities market, encompassing the entire market-cap spectrum. | 2.028,34 |
| 5 | Vanguard Short-Term Corporate Bond | Market-weighted index of investment-grade, fixed-rate corporate bonds with maturities between 1 and 5 years. | 1.776,67 |
| 6 | iShares TIPS Bond | Market-value-weighted index of US Treasury inflation-protected securities with at least one year remaining in maturity. | 1.333,90 |
| 7 | Vanguard Intermediate-Term Corporate Bond | Market-weighted index of investment-grade corporate bonds with maturities of 5-10 years. | 1.136,77 |
| 8 | Vanguard Total International Stock | Market-cap-weighted index of global stocks covering 99% of the world's global market capitalization outside the US | 974,74 |
| 9 | Xtrackers USD High Yield Corporate Bond | Index of USD-denominated high-yield corporate bonds with 1 to 15 years remaining to maturity | 974,02 |
| 10 | ARK Innovation | Targets companies poised to benefit from disruptive innovation in one of three areas: industrial innovation, genomics or Web x.0. | 944,13 |
If we compare the tables showing the ETFs with the largest inflows and outflows of funds with the previous table showing the ETFs that our clients traded the most, we can see that foreign investors are somewhat more conservative. This can be partly explained by the fact that our investors mainly invest in shares and indices, and less in bonds. As you can see in the table above, 4 out of 10 most popular ETFs among global investors have invested bonds as their underlying asset class. On the other hand, the larger outflows were seen in ETFs tracking the S&P 500.
Top 10 ETFs According to Outflow of Funds
| wdt_ID | ETF | Underlying asset | Outflow USDm |
|---|---|---|---|
| 1 | SPDR S&P 500 | S&P 500 index | -2.471,38 |
| 2 | Vanguard Growth | CRSP US Large Cap Growth Index | -1.716,83 |
| 3 | iShares Short Treasury Bond | Index composed of U.S. Treasury bonds with remaining maturities one year or less. | -1.716,10 |
| 4 | iShares 20+ Year Treasury Bond | Index composed of U.S. Treasury bonds with remaining maturities greater than twenty years. | -1.519,44 |
| 5 | SPDR S&P Dividend | S&P High Yield Dividend Aristocrats Index | -1.505,35 |
| 6 | iShares Russell 1000 Growth | Russell 1000 Growth Index | -1.312,72 |
| 7 | ProShares UltraPro QQQ | Three times the inverse (-3x) of the daily performance of the Nasdaq-100 Index | -1.040,20 |
| 8 | ProShares S&P 500 Dividend Aristocrats | S&P 500 Dividend Aristocrats Index | -1.025,06 |
| 9 | SPDR Bloomberg Barclays 1-3 Month T-Bill | Bloomberg Barclays US Treasury Bills 1-3 Month Index | -755,15 |
| 10 | iShares MSCI USA Min Vol Factor | Index composed of U.S. equities that, in the aggregate, have lower volatility characteristics relative to the broader U.S. equity market | -701,47 |
Finally, it is important to note that price movements described in this text are a result of trading in August and are subject to future changes.
In August 2020, Croatia observed a fall in tourist arrivals by -46.16% and a fall in tourist nights by -36.37%.
According to the Croatian National Tourist Board, in August 2020, Croatia observed 2.68m tourist arrivals, representing a decline of 46.16% YoY (4.97m arrivals in August 2019). Such figures indicate that the average stay per person increased from 6.7 nights to 7.9 nights.
Foreign tourists accounted for 2.23m (or 83%) of total arrivals, representing a decrease of 51.4%. Meanwhile, they accounted for 17.09m of total nights realized (or 81%), representing a decrease of 41.1%. Such figures show a positive trend regarding a slowdown in decline in tourist arrivals and night released compared to the beginning of the Covid-19 outbreak. It is worth noting that arrivals in August account for roughly 25% of total arrivals.
As July and August account for the majority of the Croatian touristic season it is also worth looking at the value of taxable invoices to further observe the impact of a lower performing tourist season. According to the Tax Administration of the Republic of Croatia in the period from 24 February until 30 August 2020, the value of taxable invoices decreased by 19% YoY. Drop in taxable invoices in wholesale and retail trade in the same period was only at 10% while drop in accommodation and food services was at 46%.
As a reminder, in April, due to the lockdown, Croatia has witnessed extremely low figures when it comes to foreign arrivals. To put things into perspective, in April, Croatia observed 2,349 arrivals compared to 2.87m in the same month last year. Meanwhile in May, Croatia observed a fall in tourist arrivals by -94.8% and a fall in tourist nights by -90.7%.
Tourist Arrivals (August 2020)
Tourist Nights (August 2020)
Tourists from Germany recorded the most tourist arrivals and nights in August, accounting for 25.2% of all nights realized. Note that German tourists recorded a 17.9% YoY decrease in nights realized, which could be deemed as a relatively low decrease given the Covid-19 situation. Tourists from Slovenia and Poland follow, accounting for 13.2% and 10.65% of nights realized, respectively.
When observing the arrivals realized by counties, Istria leads the list with 24% of the total arrivals. The counties of Split-Dalmatia and Kvarner follow, accounting for 20.6% and 18.6% of total arrivals, respectively. Looking at tourist nights, Istria county comes first with 24.4%, followed by Kvarner with 19.8%.
Turning our attention at the nights realized by the type of accommodation, one can observe that private accommodation leads the list with accounting for 46% of total nights. Camps follow with 15.3% of nights realized in them.
Note that hotels recorded 514,155 arrivals (-56% YoY) and 2.5m nights (-51% YoY). It is also worth noting that the nights realized in hotels account for 11.09% of total nights realized, which represents a decrease of 3.54 p.p. Such a decrease does not come as a surprise, given that certain hotels were not open due to the Covid-19 pandemic, so the demand shifted more towards private accommodation.
For today, we decided to present you with an updated asset structure analysis of Croatian UCITS funds.
Since asset managers play a significant role in the Croatian capital market, it is particularly interesting to see how they have been affected by the ongoing Covid-19 situation. As the global financial markets, as well as the Croatian capital market, observed a partial rebound in April and the following months, it is worth seeing how Croatian UCITS funds performed during that period.
As visible from the graph below, NAV of all funds has witnessed a steady increase for each consecutive month since April, and as of end July stood at HRK 16.81bn (+1.6% MoM or HRK 260.4m). This still represents a decrease of 25.5% YTD. As a reminder, in late February until late March UCITS funds recorded the majority of the yearly decrease in their NAV. HANFA noted earlier this year that since 21 February until 24 March, 86.1% of the decrease could be attributed to withdrawals from the funds, while the rest 13.9% can be attributed to a change in value of assets in which the funds invest. As turmoil on financial market subsided withdrawals from funds were halted, but the value of most financial instruments has not yet returned to pre-crisis levels.
Asset Structure of UCITS funds (July 2020)
Looking at the asset composition of Croatian UCITS funds, it seems that asset managers have not changed significantly their composition, which can be seen in the graph above. Since the beginning of 2020, we witnessed a considerable decrease of bonds in the assets structure which went from 65% in January 2020 to as low as 59% (April), while as of July 2020 bonds take up for 62.9% of the total assets. Such a decrease could mainly be attributed to withdrawals from funds which (predominantly) invest in the mentioned asset class.
Shares have observed a gradual increase in total assets since February, and currently account for 8.5% of the total assets. Note that domestic shares account for 29.3% (or HRK 433.76m) of the total equity held by Croatian UCITS funds. To put things into a perspective, as of July 2020, Croatian Mandatory Pension funds managed a significantly higher amount in domestic shares (HRK 11.22bn), which accounts for 9.9% of their net assets. This indicates that mandatory pensions funds account for roughly 22% of the free float market cap of ZSE, whereas Croatian UCITS funds account for roughly 1%.
Total Assets of All Croatian UCITS Funds (2015 – July 2020) (HRK bn)
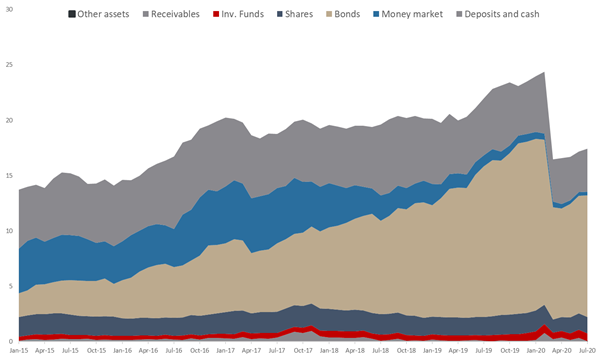
Source: Croatian Financial Services Supervisory Agency, InterCapital Research
To put things into a perspective, the deal accounts for roughly 57% of the company’s trailing 12m consolidated revenues.
Đuro Đaković Group published an announcement stating that Đuro Đaković Specijalna vozila, the company within the Group and the Swiss client, contracted production and delivery of freight wagons Uacns worth HRK 127m. To put things into a perspective, the deal accounts for roughly 57% of the company’s trailing 12m consolidated revenues. Note that the delivery of the wagons is planned for 2021 and 2022.
The company notes that with this project Đuro Đaković Specijalna vozila confirms commitment and strategic orientation towards the development and production of special purpose wagons, with the application of new generation production equipment with which the company in the meantime completes its development and production processes.