Last week we have seen bonds plunging to new multi-year lows with 10Y bund yield reaching almost 1.20% while 10Y Treasury paper touched 3.20%. However, this week bonds rebounded, and curves flattened due to higher risks of a recession. In this article we are looking at the major forces driving enormous volatility on rates.
After rising since the beginning of December 2021 with exception of a short period of risk off due to the Russian invasion, bond yields finally found support this week. Namely, on Monday we saw US10Y reaching 3.20% while the European benchmark almost touched 1.20% mark. Just to put things into perspective, that rise came after the worst quarter for bonds in history, and April in which yields on longer term global bonds went up by 50bps. However, equity markets kept losing their ground with many global indices being in a bear market and a significant number of tech names being more than 50% below their highs from 2021. There are several headwinds for equity indices with economic slowdown, high inflation, and higher interest rates being only the strongest ones. Nevertheless, for the most part of 2022, bonds were falling together with equities because markets had to reprice hawkishness of central banks and repricing was stronger compared to flight to safety bid. Nevertheless, this week correlation once again went to “normal” i.e., negative, with bonds rising while equities are falling. Bonds found support on Monday with flight to safety bid but also it could be that many market participants closed their short positions with massive gains.
On Wednesday, US Bureau of Labor Statistics published US CPI which showed that inflation is still above all expectations, with YoY data being below March but still at 8.3% while core inflation in MoM terms increased from 0.3% in March to 0.6% in April. Furthermore, the data showed that many core services’ prices showed acceleration and that inflation infiltrated in every part of the economy. Last week Fed decided to hike its rates by 50bps but decided to move 75bps from the table and markets quickly repriced rate forwards to exclude such hike. However, bearing in mind stubbornness of inflation there is a long way for Fed to think about bigger hikes in the future.
After the inflation data was published on Wednesday, bonds first fell sharply, coming close to their lows from Monday but closing above the opening. To be specific, 10Y bund yield opened slightly above 1.0%, rose to 1.10% after the data was published, and closed the day below 1.0%. And then yesterday we saw second biggest fall of yields this year, with bund yield falling towards 0.85%. So, the most important question this week is what was the driver of yesterday’s move? Most obvious is that economic slowdown is more and more priced and market bets that central banks will not be able to deliver such a strong pace of tightening without totally breaking the economy and will have to pause. Also, equity indices continued falling with SPX being below 3900 (high of 4818 on 4th of January 2022) being very close to bear market which pushed some investors to safer assets such as bonds. And last, yesterday we saw Finland saying it will apply to join NATO which could increase tensions between Russia and NATO and increase risk of nuclear war.
We already saw similar moves in bond markets at the beginning of March 2022 when EUR yields were negative once again. But after that, we witnessed one of the sharpest rises in yields on record. Volatility in bond markets is almost unseen and we expect bond markets to be very volatile as long as we have so much uncertainty on the plate.
Chart 1. RXA, 5-day period
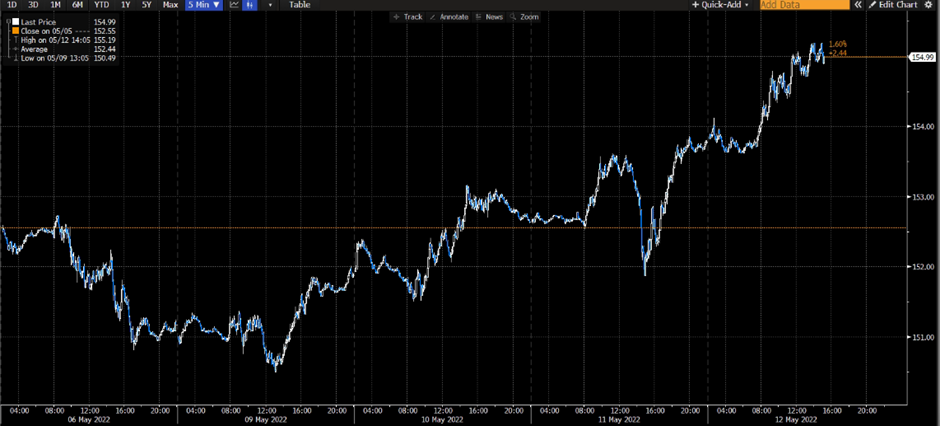
Source: Bloomberg
SHD proposed EUR 1.14 DPS, while VZMD proposed EUR 1.10 DPS.
Luka Koper has received two dividend counterproposals from SDH (Slovenski Državni Holding) and VZMD (Pan-Slovenian Shareholders’ Association).
To be specific, SDH as the majority shareholder (representative of Republic of Slovenia) proposed a dividend payment of EUR 15.96m, which translates into a dividend of EUR 1.14 per share. At the current share price, dividend yield is 5%. Meanwhile, ex-date is 29 August 2022.
On the other hand, VZMD proposed a dividend payment of EUR 15.4m, which translates into a dividend of EUR 1.10 per share. At the current share price, dividend yield is 4.8%. Meanwhile, ex-date is 27 July 2022.
As a reminder, the Management and Supervisory Boards proposed that EUR 9.94m is to be used for dividend pay-out in the gross value of EUR 0.71 per share. Such a dividend payment is EUR 0.43 per share lower than the one paid in 2021.
Luka Koper Dividend per Share (EUR) & Dividend Yield (%) (2013 – 2022)
Producer prices of industrial products on the domestic market increased by 28.4% YoY in April 2022. The energy sector still remains the main driver of this increase, and if we were to exclude it, the increase would amount to 7.8% YoY.
Croatian Bureau of Statistics has published its monthly report on the movements and trends in the industry sector. In it, we can see that the industrial producer price index on the domestic market increased by 28.4% YoY. If we were to exclude the energy sector, the total industrial PPI increase would amount to only 7.8% YoY in April 2022.
The increase can also be witnessed across various industrial sectors. On a MoM basis, PPI in Non-durable consumer goods grew by 1.5%, in Intermediate goods it grew by 1.2%, in Durable consumer goods it grew by 0.1%, and in Capital goods, it increased by 1.1%. Of course, the largest increase can be attributed to the growth the PPI experienced in the Energy sector, which grew even further by 5.6%, MoM, after an already big surge.
On a YoY basis, the story is similar. Industrial PPI increased by 86.7% in the energy sector, in Intermediate goods by 10.5%, in Durable consumer goods by 6.1%, in Non-durable consumer goods by 6.9%, while in Capital goods it grew by 4.5%. This means that the growth of the PPI is experienced across all segments of the industry, but the increase in the Energy sector is by far the largest. If we were to break down the PPI increases in the energy sector, the largest increase by far came in the Minning and quarrying segment, which grew by 271.9% being by far the biggest driver. PPI in Electricity, gas, steam, and air conditioning supply increased by 32.1%, and in Manufacturing it grew by 15.1%.
Producer prices of industrial products (June 2016 – April 2022, each month, YoY, %)
The current geopolitical tensions, caused by the Russia-Ukraine conflict, are bound to continue in the next period, therefore pressures on the producer prices in the energy sector are here to stay. When looking at the forecast for Brent price in 2022, it stands at 101 USD per barrel which is close to the current spot of USD 108.86, so we cannot expect to see an easing of price pressures soon. The 2023 forecast stands around USD 90 per barrel so high oil price conditions are here to remain for some time. As producers require many more commodities like oil and gas, pressure on producer prices is even more exacerbated by these strong price increases. Brent crude currently stands at 69% above its five-year average. It is also 52% above its 10-year average. In 2021 thus far, its price was up 40% YTD.
Brent oil prices (January 2010 – today, USD/bbl)
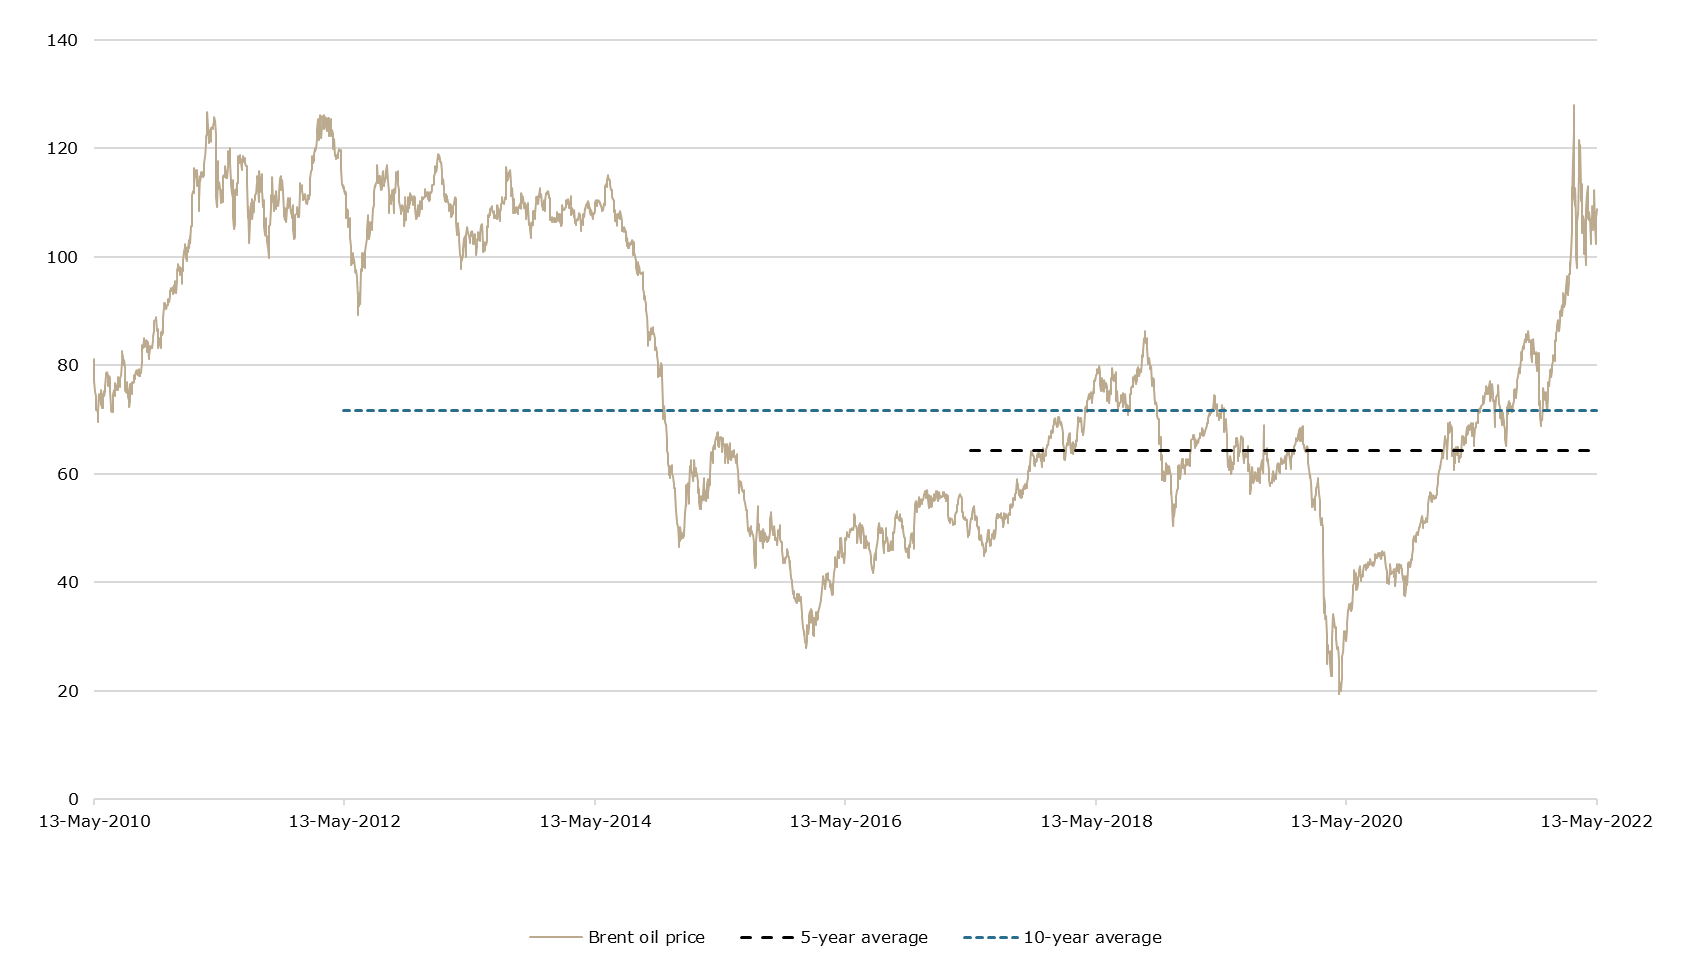
Source: Bloomberg
Next, we took a look at the natural gas prices. Due to the importance of Russian natural gas to the European economies, as well as the escalation of tensions in the past several weeks (Russia stopping gas exports to Poland and through Poland to some entities in Germany, Russia stopping natural gas exports to Bulgaria, a key transportation point in Ukraine getting closed due to the conflict, etc.) has also had a significant impact on the natural gas prices, and by extension, producers who use it. Currently, natural gas prices (NG1 Commodity Future from Bloomberg) stand at 7.68 USD/MMBtu, which is an increase of 106% YTD, above its 5-year average by 151%, and above its 10-year average by 143%. As the European countries scramble to find alternatives, which requires time, these high prices are expected to continue rising, especially if the current situation escalates further.
Natural gas prices (NG1 commodity futures, January 2010 – today, USD/MMBtu)
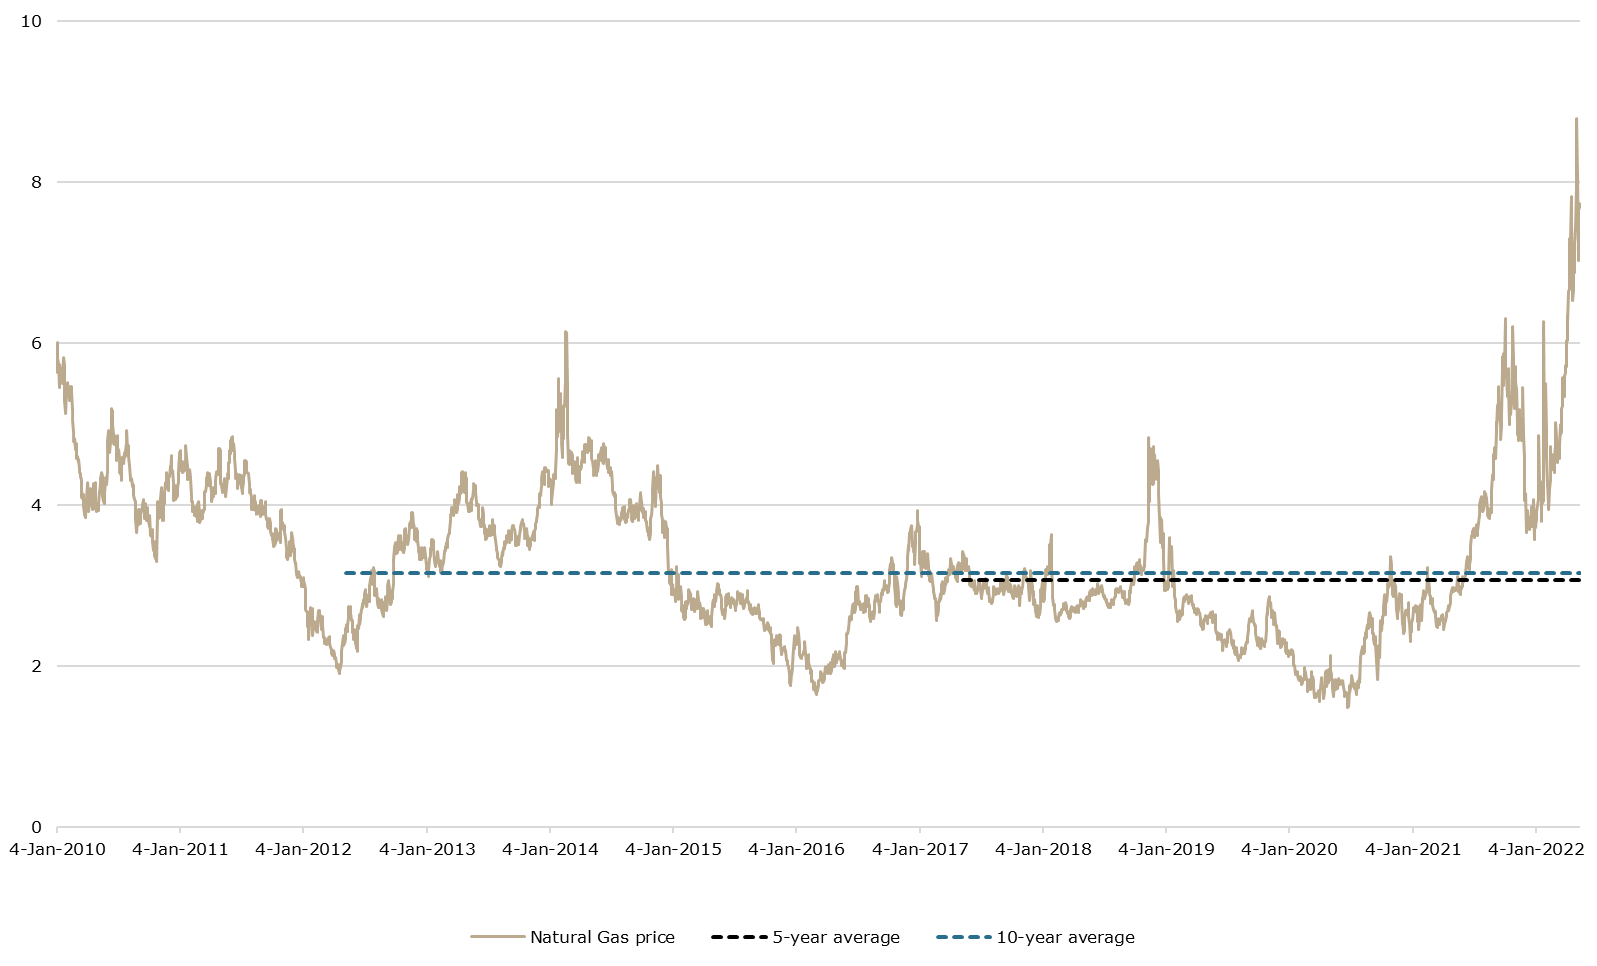
Source: Bloomberg