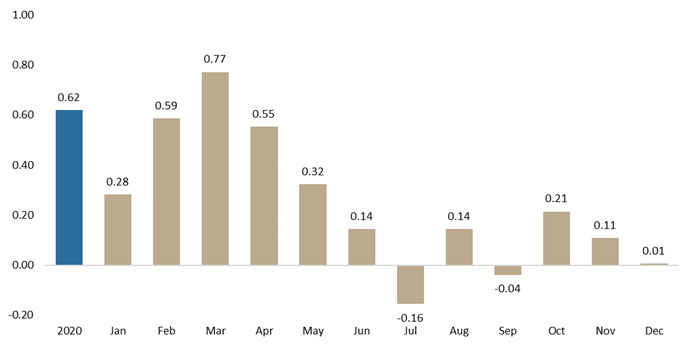
In 2020, the coefficient of correlation between CROBEX and S&P500 was 0.62.
If you have been following both Croatian and the US equity market in 2020, you might have seen certain similarities in the movement of CROBEX and S&P500 in the beginning of the pandemic. Since then the correlation between the indices has substantially decreased, so we decided to look at the how correlated were the indices in 2020.
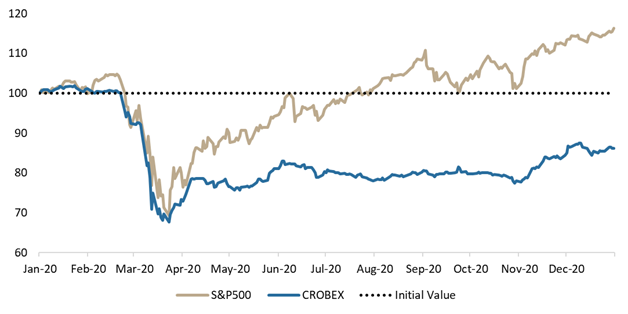
While S&P500 ended the year with a very solid increase of as much as 16.3%, CROBEX has lagged behind its regional peers and ended the year at -13.8%. There are many reasons for such a difference in performance between indices, but it is worth pointing out that technology companies which have benefited to some extent in this pandemic account for roughly one fifth of S&P500 (such as Microsoft, Amazon, Google etc.). Meanwhile, many CROBEX heavy-weights were quite affected by the Covid-19 crisis.
Performance of CROBEX and S&P500 in 2020
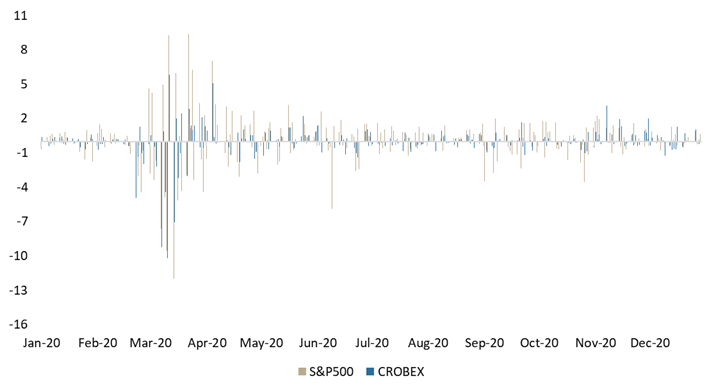
If we were to take a closer look at daily movements of the indices, one could have observed an interesting correlation during March and April, which is visible in the graph below. Since the Covid-19 outbreak, one can notice that almost every time in March and April when S&P500 recorded a sharp daily increase or decrease, the same movement of CROBEX was observed. This can be also confirmed when calculating the coefficient of correlation of March and April returns of both indices, which amounts to 0.77 and 0.55, respectively, showing a solid correlation between the movement of the indices. This has not been historically the case (to such extent) as the coefficient of correlation for the same parameters since 2007 amounts to only 0.36.
Such a correlation could imply that since the outbreak of the Covid-19 crisis many investors in the Croatian equity market were not necessarily basing their investment decisions on fundamentals or the local news, but rather on the global sentiment. This would not surprise us as many fundamental parameters were and are still in a very unknown territory such as the end of the Covid crisis, or the impact on the macro picture across economies.
Daily Change of CROBEX and S&P500 (%) in 2020
However, since than the situation has quite changed, which can be seen when looking solely at the correlation between the indices since May onwards (for each month individually).
Such figures show that the indices were not as correlated during the partial bounce back as they were during the drop. It is also worth noting that as more fundamental parameters become clear in the local market, it is reasonable to expect a lower correlation then the current (on the YTD basis). Interestingly enough, in November, we also observed a very low correlation between the indices, despite a positive sentiment globally which came on the back of vaccine news during which CROBEX surged by 8.1%, while S&P500 rose by 10.8%.
Coefficient of Correlation (CROBEX vs S&P500)
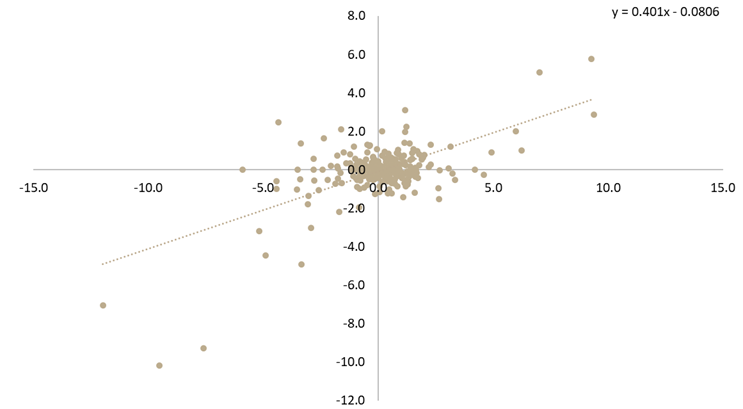
If we were to run a regression of daily returns of CROBEX and S&P500 in 2020, the slope of the regression gives us additional information of relative volatility of CROBEX. In the graph below, you can see that the slope of the regression amounts to 0.40 indicating that CROBEX has been roughly half as volatile as S&P500. So for example, an increase of 10% of the S&P500 would indicate a 4% increase of CROBEX.
Regression of 2020 Daily Changes of CROBEX Against S&P500
In first 11 months of 2020, GWPs recorded an increase of 2.34% YoY. Of that Non-life observed an increase of 3.36%, while Life is down for the fist time this year by 0.1%.
The Slovenian Insurance Association published their monthly update on the GWP development in Slovenia. In the first 11 months of 2020, the Slovenian insurance market observed an increase in both life and non-life segment, leading to a total GWP growth of 2.34% YoY, amounting to EUR 2.367bn.
Non-life segment, which accounts for 71.3% of the total GWPs, recorded also an increase of 3.36%. Such an increase came on the back of a very strong health insurance performance, which recorded an increase of 7.72% YoY and is the largest non-life item in Slovenia (25% of total GWPs). The increase arguably came mostly on the back of increasing prices of health insurance premiums.
It is noteworthy that land motor vehicles insurance observed an increase of 3.53%, amounting to EUR 298.99m. Meanwhile motor vehicle liability insurance witnessed a slight decrease of 0.03%, amounting to EUR 256.3m. Of all insurance segments, Credit insurance observed the highest decrease of 21.3%. This does not come as a surprise given the expected lower loan issuance activity in Slovenia as a result of Covid-19 outbreak coupled with the restrictions on the consumer loans placed by the Bank of Slovenia in November 2019.
Turning our attention to the life segment, it recorded a YoY decrease for the first time in 2020 and is down by 0.1 YoY. To be specific, the entire life insurance segment amounted to EUR 680.6m. Within the segment, unit-linked life insurance observed decrease of 5.15%.
GWPs by Insurance Segment (Jan – November 2020) (%)
Solely November 2020
When observing solely November, GWPs stood at EUR 194m, which notes a solid decrease of 6.7% YoY or EUR 14m. The mentioned decrease came equally on the back of a lower performance of life (-10.3% or EUR 7m) and non-life insurance segment (-5% or EUR 7m). In the non-life segment, other damage to property insurance witnessed a plunge by 35% or EUR 5.4m On the other hand, health insurance remained in the positive territory (+0.6% MoM).
In the life segment, we can observe a sharp decrease in unit linked insurance of 23.8% MoM or EUR 5.94m.