A few days ago the World Bank published its overview of the Croatian macroeconomic position with the main findings focusing on the long-term growth prospects and productivity of Croatia. We decided to point out key findings and the insight provided by this research.
A few days ago the World Bank published its overview of the Croatian macroeconomic position called „Croatia Country Economic Memorandum—Laying the Foundations: Boosting Productivity to Ensure Future Prosperity in Croatia“. This overview focuses on the long-term growth prospects and productivity of Croatia. Also, the World Bank applied its Long-Term Growth Model to estimate Croatia’s growth prospects until 2050 and stimulated different policy reform scenarios. Below you may find the key takeaways.
The modern history of Croatia’s economic development
First things first, Croatia’s macroeconomic development in the last two decades was described to put the country’s development in context. So let’s start with this. In the 2002 – 2008 period GDP growth averaged a robust 4.5% per year, accelerating per capita income convergence with the EU to a pace comparable with Croatia’s peers in the CEE. However, the rise in consumption and investments were financed by debt, which consequently, led to a significant increase in the financial liabilities of both households and firms. Further, export remained modest, while the elevated increase in domestic demand resulted in a surge in imports. This led to the current account deficit as a share of GDP reaching double digits by 2008, which left Croatia vulnerable to the crisis that was about to happen and which lasted until 2014.
A more favorable external environment, along with the positive EU effects helped to reignite growth in the period 2015-2019. However, average GDP growth was lower compared to the 2002-2008 period and amounted to 3%. A more balanced growth composition was noted, shifting from debt-financed domestic demand towards more export-led growth. Overall, Croatia reached c. 70% of the average EU income per capita in 2021 (stood at 50% in 2001!). However, this also reflected a fall in population.
GDP growth and contribution to growth (p.p.)
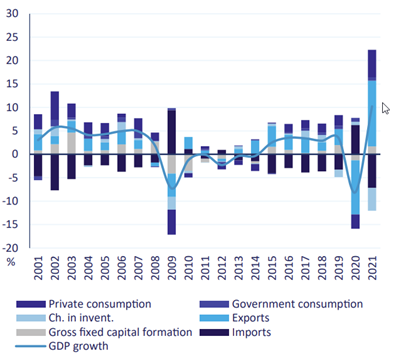
Source: The World Bank calculation, Eurostat
Overall Croatia showed resilience
This paragraph will be short, as more or less we all witnessed and are aware of shocks that occurred in the past few years. Croatia’s mentioned growth was only interrupted by the pandemic with a rapid rebound. The economic activity reached pre-pandemic levels by the H1 and the reopening of the economy combined with a large fiscal stimulus package. Further, Croatia was also less affected by the more recent global supply chain bottleneck given its export structure, which, together with a strong global recovery, led to a solid rise in export. On top of that, even with the current geopolitical headwinds, Croatia managed to remain resilient. Overall, the strong economic growth in 2022 is reflected in double-digit export growth and robust domestic demand.
What is expected in the medium & long term?
Croatia’s growth is expected to benefit significantly from the Recovery and Resilience Facility, as well as the structural and investment funds from the new financial perspective. Total RRF disposable granted fundings amount to EUR 5.5bn (close to 10% of 2019 GDP) and are meant to finance important reforms & investments. However, the funding will take place only if agreed reforms and investments set out in the National Recovery and Resilience Plan are fulfilled and implemented. In short, digital infrastructure and green transition are in the spotlight. Additional EUR 9.1bn of cohesion policy funding is available for both public and private investments. With that mentioned, those investments could boost Croatia’s potential growth.
GDP growth is expected to remain relatively robust over the next three years, supported by the aforementioned investments. However, in the long term (until 2050) the per capita growth is expected to gradually decline. The growth slowdown arises from various structural headwinds. Croatia is aging rapidly with the working-age population forecast to decline from 64% in 2020 to 57% in 2050. Human capital growth is expected to be sluggish due to pre-tertiary education and should partially offset the boost from one-off EU funds.
Drivers of growth – Croatia
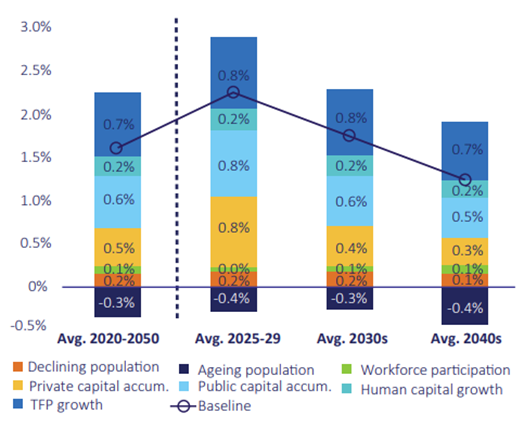
Source: The World Bank
Back to the core – Productivity…?
Croatia’s potential growth is among the lowest in the CEE region as productivity contributes the least. The estimated potential output growth amounted to 1.6% per year on average for the period 2015-2019, which is the lowest growth among regional peers and about half of the average for the CEE region. Further, labor productivity grew with significant gaps to Croatia’s peers as well as (of course) more advanced frontier economies. Compared to Germany, it took on average almost three Croatian workers to produce the same value-added generated by a single German worker in 2019. Underlying effects on labor productivity are business dynamism, competition, management practices and the use of technology. Even though the labor productivity shortfall in Croatia relative to Germany as the regional frontier economy is mainly accounted for by differences in productivity within sectors, it’s still partially due to Croatia’s economy. For example, even if Croatia had the same sector composition as Germany, it would still be 57% less productive. Below you may find potential growth of Croatia compared to its regional peers. Further, Croatia’s low firm productivity reflects insufficient R&D investments and innovation and technology adoption, lagging managerial and organizational practices, as well as the constraints on the competition! Below you may find interesting visualization regarding R&D expenditures.
Potential growth (2015 – 2019 average, p.p.)
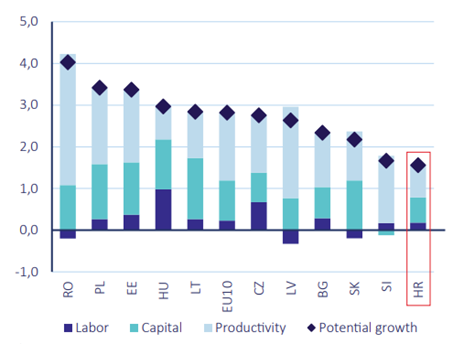
Source: The World bank
Regarding the public sector, clear underperformance is noted and this is considered a constraint on business dynamism and market entry. Inefficient government bureaucracy, the slow legislative process and policy instability are stressed as the main factors. Consequently, inadequacies of the business environment have the largest scope for improvement and are a major constraint to firm growth and productivity.
To conclude, improving the drivers of long-term growth would speed up economic convergence, allowing Croatia to close the gap with the EU average in the last 30s. This could be achieved by a number of possible solutions: improving the legislative drafting process, strengthening the business licensing process, simplifying tax administration, improving absorption and impact of EU funds, reducing the administrative burden in public procurement, investing in R&D, removing barriers to trade, invest in a skilled workforce and a few others.
According to the preliminary 2022 results, BVB recorded revenue growth of 21% YoY, EBITDA growth of 86%, and a net profit of RON 10.4m, an increase of 97% YoY.
In 2022, the sales revenue of BVB amounted to RON 55.4m, an increase of 21% YoY. Looking at the revenues by segment, the standalone BVB op. revenue increased by 23% YoY, or RON 6.1m, which was driven by a 25% increase in trading revenues, mainly due to share public offer revenues, which increased by RON 4m YoY, and finally, a 7% increase in revenues from the shares main market-regular transactions. Central Depository op. revenues increased by 23% or RON 4.54m YoY. This came as a result of growth in revenue from both the post-trading segment as well as the registry, due to an increase in some tariffs, the avg. value of the financial instruments portfolio and the value of settled transactions.
Moving on to operating expenses, they increased by 10% YoY and amounted to RON 47.8m. This growth was under the influence of several factors. First of all, a 21% increase to RON 26.7m of consolidated personnel expenses, influenced by the impact of estimates related to annual performance bonuses, incl. the alignment of the Central Depository to the accounting policies adopted at the Group level, and the annual application of the Remuneration Policy – indexation and adjustment to the market level. Secondly, a 24% decrease in expenses with third-party services to RON 6.2m, as a result of lower consulting services recorded by CCP.RO. Thirdly, a 12% increase in other op. expenses to RON 14.9m following the increase in fixed assets depreciation and IT maintenance expenses, as well as an increase in the admin. expenses, due to rising inflation.
This resulted in an EBITDA of RON 14.25m, an increase of 86.2% YoY, mainly driven by faster revenue than op. expenses growth. Moving on, the consolidated net financial result amounted to RON 3.52m, a 5% decrease YoY. Individually, the net financial income from the Central Depository increased by 138% due to the higher interest on financial instruments. Net financial income from CCP.RO decreased by 40% YoY and amounted to RON 1.03m, due to the appreciation of RON vs EUR, and thus the adverse impact on the value of investments denominated in EUR. Finally, the net financial income of BVB standalone amounted to RON 2.9m, an increase of 41% YoY, based on the dividends income from Central Depository for 2021, in the amount of RON 1.53m. Also, the gain from unrealized FX differences was lower, as a result of the RON vs. EUR appreciation, but also due to the adverse impact of RON/USD FX fluctuation recorded during 2022 on the financial investments in USD. BVB notes that the dividend revenue from the Central Depository is eliminated during the consolidation process, and as such is not included in the consolidated financial income.
Moving on to the net profit, on the Group level it amounted to RON 10.43m, an increase of 97% YoY, being directly influenced by the positive evolution of the op. result.
BVB Group key financial results (Preliminary 2022 results vs. 2021 results, RON ‘000)
Source: BVB, InterCapital Research
Moving on to the balance sheet, the total assets increased by 5% YoY and amounted to RON 198.6m. Breaking this down further, fixed assets increased by 10% YoY and amounted to RON 77.5m, influenced by the acquisitions of financial assets with a maturity higher than one year, made during 2022. Current assets also increased to RON 121.1m, an increase of 2% YoY, based on the increase in trade receivables of the trading segment.
Moving on to the passive side, the total liabilities are mostly short-term and have remained roughly the same YoY. Equity amounted to RON 154.2m, an increase of 2% YoY, due to the share capital increase of CCP.RO performed at the end of December, through the cash contribution of RON 7m by a new shareholder, which determined the increase in minority interests and the decrease of BVB share in CCP.RO from 59.52% to 54.72%.