ESG or, put simply, responsible investing has seen a rapid increase in popularity in the recent years. With the new SFDR regulation coming into place in EU, we decided to answer an important question – How much CO2 (and equivalent gases) can be attributed to EUR 1m invested in CROBEX10 and SBITOP?
Our colleagues from the asset management department have recently published a blog in which they calculated the CO2 emission which can be attributed to EUR 1m invested capital in their equity funds. With ESG practices being increasingly popular both from an investor and regulatory standpoint, we decided to dedicate this week’s blog to carbon footprint of investing in CROBEX10 and SBITOP.
Let’s suppose you want to invest EUR 1m in CROBEX10 or SBITOP. How much CO2 (and equivalent gases) can be attributed to your investment?
To answer this question and be able to compare the figures, EU is changing its regulative. To be specific, Sustainable Finance Disclosure Regulation (SFDR) is intended to increase transparency on sustainability among financial institutions and market participants. The regulation consists of disclosure requirements on the organizational, service and product levels to standardize sustainability performance, hence preventing “greenwashing” and enabling comparisons for sustainable investment decisions.
In order for us to be able to calculate the data for each index, we obviously need data of each individual constituent within index. Emission reporting can include 3 different scopes:
Scope 1 – All Direct Emissions from the activities of an organization or under their control. Including fuel combustion on site such as gas boilers, fleet vehicles and air-conditioning leaks.
Scope 2 – Indirect Emissions from electricity purchased and used by the organization. Emissions are created during the production of the energy and eventually used by the organization.
Scope 3 – All Other Indirect Emissions from activities of the organization, occurring from sources that they do not own or control. These are usually the greatest share of the carbon footprint, covering emissions associated with business travel, procurement, waste and water.
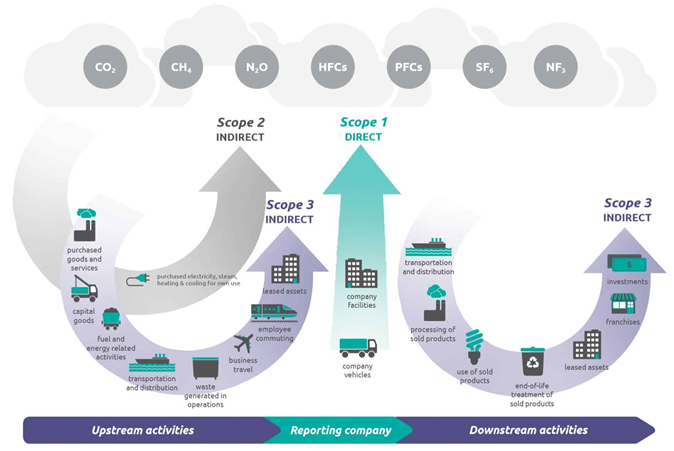
Source: GHG Protocol, InterCapital
According to Bloomberg, when looking at the Croatian and Slovenian market, we can note that only a few companies actually report data for Scope 1 and Scope 2, while Scope 3 reporting is practically nonexistent on the market. We also note that some companies might be reporting the aforementioned, however, it is also possible that Bloomberg did not retrieve such data from the companies. To put things into a perspective, 10% of the SBITOP constituents are reporting Scope 1, 2 and 3 (that being Krka), while none of CROBEX10 constituents are reporting Scope 1 and 2. As a comparison, 73% of DAX constituents are reporting both Scope 1 and 2, while 60% are reporting Scope 3.
Given that there is very limited Scope 3 data, we decided to keep our calculation at solely Scope 1 and 2. In order for us to calculate the carbon footprint of the index, we used the actual data of companies reported on Bloomberg. If that data is not reported by the company, we used Bloomberg’s estimates which are predominantly based on factors such as revenue per business line (biggest emphasis), geographical location, company policies, revenue, production units, total assets, number of employees etc.
In case we lack both of the above mentioned, we made an assessment based on the size of its revenues and the industry in which a particular company operates. We also note that we have taken into consideration EUR 1m of invested capital (EV) for all companies besides financials, where we have taken market cap into consideration.
By doing so we reach a figure of roughly 164.2 tons of CO2 per EUR 1m of invested capital in CROBEX10. In other words, according to United States Environmental Protection Agency, the mentioned would be equivalent to roughly the emission from 36 passenger vehicles driven for one year.
For SBITOP, that figure amounts to roughly 150 tons of CO2 per EUR 1m of invested capital.
We note that the above-mentioned figure may not be completely accurate given the majority of the emission is based on an estimate. We would be happier to see more and more companies report at least their Scope 1 and 2 so we could have a more accurate representation of the above mentioned.
As visible from the graph, such emission is somewhat lower that the one of DAX, while the one of S&P500 is the lowest of all observed indices. The reason behind such a difference could be explained by the industry in which the index heavy weights operate in, as S&P500 has a higher weight of tech companies.
Tons of CO2 per EUR 1m of Invested Capital
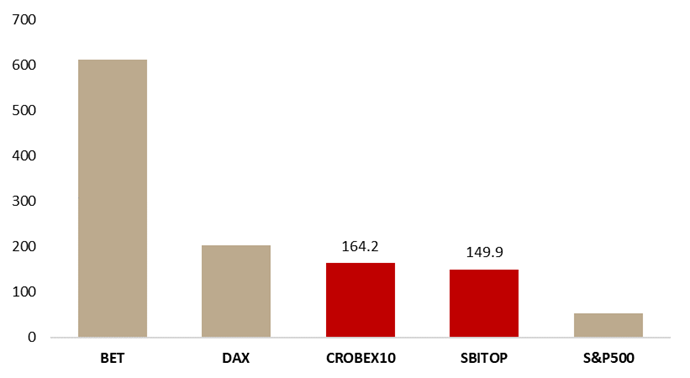
Source: Bloomberg, InterCapital Research
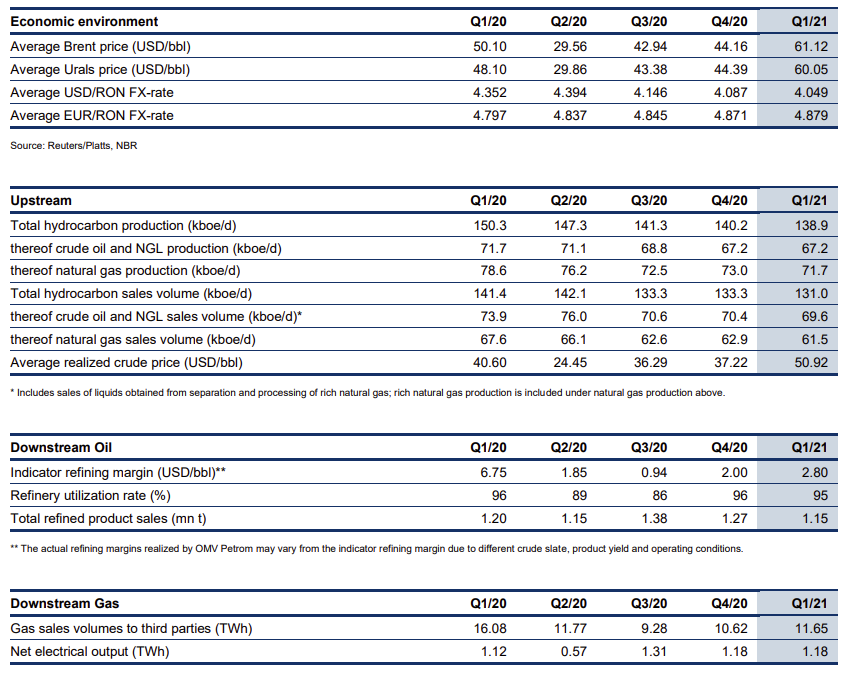
The Group’s results for Q1 2021 will be published on 29 April 2021.
Omv Petrom published their Q1 2021 KPI’s, which can be seen in the table below. The Group’s results for Q1 2021 will be published on 29 April 2021. The company notes that the information contained in the trading update may be subject to change and may differ from the final numbers of the quarterly report.