On Friday, the Croatian Bureau of Statistics published its first estimate on GDP for 2020 showing that in real terms it decreased by 8.4% YoY, while in the same period Slovenian economy contracted by 5.5%. In Q4, Croatia noted a contraction of 7.0% YoY (real growth rates), while Slovenia reported a drop of 4.5%.
Croatia
According to the first estimates of Croatian Bureau of Statistic, GDP witnessed a decrease of 8.4% in 2020. When looking solely at Q4, seasonally adjusted data showed an expansion by 2.7% compared to the previous quarter, while on a comparison with same quarter of previous year the economy contracted by 7.0% YoY. This has been in relative terms, the lowest quarterly YoY decrease since the outbreak of the Covid-19 pandemic.
Final consumption, the main contributor to GDP, was down by 2.9% in Q4 as lock-down in the ‘light’ format was on again from November. Travel bans continued, so decrease in tourism activity accelerated and in Q4 80% YoY drop in tourist arrivals was evidenced. Final consumption decrease was slightly higher on the level of whole 2020 when 63% YoY tourist arrivals decrease was realized. Therefore, Christmas spending was subdued and household expenditure, the biggest part of final consumption (70%), decreased by 4.5% YoY. Household expenditure decelerated its drop from the previous quarter of 7.5% YoY, while on the level of 2020 drop was at 5.6%YoY. General government’s spending, amounting to 27% of final consumption, continued to support the economy in Q4 (+1.6% YoY) by growing at the similar pace as in previous quarter (+1.5% YoY). In 2020 investments increased 3.6% YoY and the figure includes a sharp increase in inventory of 82% which is a common feature of every recession while gross fixed capital formation was down 2.3%. So, in 2020 public investments cushioned the drop of GDP and it is expected that gross fixed capital formation will be positive in 2021 and 2022 driven by investments which will be directed from EU instrument named Next generation EU, that is allocating to Croatia loans and grants in the amount equalling 18.5% of pre-Covid crises GDP.
In Q4 decrease in exports and imports of goods and services was evidenced at -9.8% and -7.6% as slow-down in flow of people and goods across borders continued. Exports of goods (+8.6% YoY) surprised with the growth rate in final quarter of 2020, as opposed to decrease in Q3 showing that demand for produced goods finally picked up. Export of goods was almost flat in 2020, showing that domestically produced goods have found their position on foreign markets. Due to strong drop in tourism in 2020, the decrease in exports of goods and services (-24.1%) was in majority driven by drop in exports of services of -44.3%. To display what a strong impact tourism has on Croatian GDP, we can see from exports of services that have in 2020 almost halved at constant previous year prices amounting to HRK 62.2bn. As Q4 already shows improvement in export of goods, we expect quick restoration of merchandise trade in 2021 we expect mid-teens goods and services exports growth. Mechanise imports in 2020 were down 10%, as slowdown in global economy resulted in supply glut of crude oil and lower activity so energy imports decreased strongly together with car sales import. As we do not see quick recovery of consumer habits to pre-pandemic times, we expect imports goods and services to increase slower than exports.
Croatian GDP, Real Growth Rates (%, YoY)*
*Quarterly Gross Domestic Product, seasonally adjusted real growth rates
Slovenia
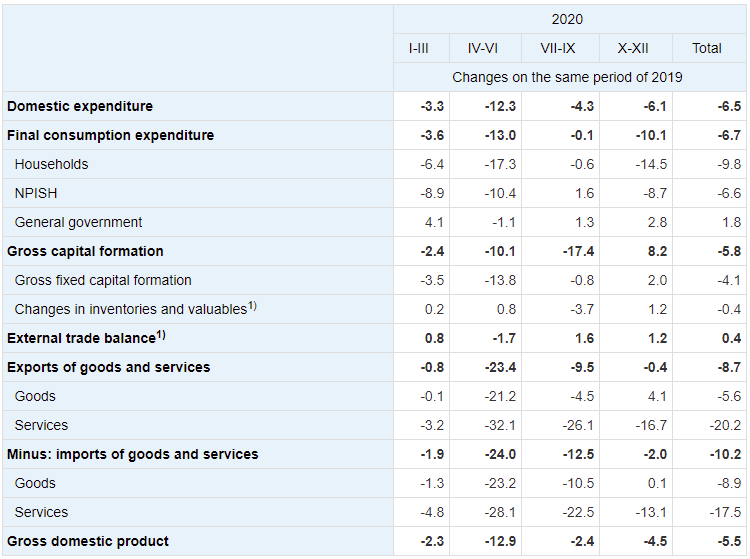
In 2020, Slovenian economy contracted by 5.5%. Meanwhile, following a relatively low decrease in Q3 of 2.4%, Q4 posted a drop of 4.5% YoY. Seasonally adjusted data shows a drop of 5% YoY in comparison with same quarter of previous year and a slight decrease of 1% compared to the previous quarter.
In the Q4, domestic expenditure declined by 6.1%; final consumption expenditure declined by 10.1%, while gross capital formation posted increase of 8.2%. Household consumption decreased by 14.5% YoY, the lowest decrease since the outbreak of the pandemic. Within household final consumption expenditure, the majority of expenses decreased, the most prominently expenditure for fuels, cars, clothes and various services. In Q4 the Slovenia had another strict lock-down that began in November where majority of non-essential services were closed which lasted until mid January 2021.
Gross fixed capital formation increased by 2.0%, mainly due to increase in gross fixed capital formation in construction. Also some other gross fixed capital formation increased, e.g. electric machines and computer hardware. In Q4 increase in inventory of 1.2% was evidenced, but despite of that on the level of whole 2020 investments were down 5.8% YoY due to drop in machinery and equipment and transport equipment due to less travel and exports. In next year we expect investments to return to growth rates as consumer spending picks up and world trade accelerates, while New Generation EU program should allow Slovenia to withdraw funds to invest in sectors where it is already expanding like green energy and digital industries.
In the last quarter, external trade balance gave positive contribution on GDP due to imports decreasing more (-2.0%) compared to exports(- 0.4%) and by 2.0%. Exports and imports of goods in the same period increased: exports of goods by 4.1% and imports of goods by 0.1%. Among services, at both exports and imports, the largest decrease was observed in travelling. On the level of 2020 net exports was the only GDP aggregate, that besides government consumption (+1.8%) positively contributed to GDP growth amounting to EUR 4.6bn and was up 0.4%. In 2020 exports of goods and services was down 8.7% YoY as external demand dropped. Exports of goods dropped by 5.6% while exports of services clearly took the hardest hit decreasing by 20.2%. In 2021 we expect Slovenian trading partners to recover so exports of goods and services are expected to grow about 10%, which could be overshadowed by stronger growth of imports due to pent-up consumer spending. So external trade balance could in 2021 negatively impact GDP growth.
Source: Statistical Office of Slovenia
In 2020, TNG recorded a decrease in sales of 11.6%, a decrease in EBITDA of 11.9% and a net loss of HRK 31.7m.
In 2020, TNG recorded a decrease in sales of 11.6% to HRK 236.96m. Tankerska noted that they did not get taken away by the lucrative spot market in H1, yet managed to use it as leverage for additional time charter coverage. In these terms, TNG managed to secure a total of 1,466 time charter days which was 2.3% YoY lower, mainly due to the number of off hire days, as four of thier ECO tankers spent in dry dock.
As a reminder, in H1 of 2020, demand for oil has fallen so severely, and at such pace, that there is little space left on land to store the crude made redundant by the coronavirus crisis. Due to the lack of land storage, oil traders were increasing their demand for floating storage, which means renting an oil tanker for the purpose of holding the cargo until oil prices improve. The increased demand for tankers, intended to be used for storage, started off back in March when oil prices decreased enough for big energy traders to be able to take advantage of a market structure called contango.
Meanwhile, the company noted that sticking to the long-term company employment strategy, TNG capitalized on limited spot exposure towards the H2 of the year in a far from lucrative period.
TNG Financials (2020 vs 2019) (HRK m)
In 2020, TCE net per operating vessel amounted to USD 14,250 per day, representing a decrease of 3.7% YoY. Meanwhile, daily operating expenses amounted to USD 6,823.
On the operating expenses side, the company noted a sharp increase of 17% or HRK 36.8m. Such an increase could almost entirely be attributed to higher value adjustments of HRK 55.7m. To be specific, the fleet’s ECO vessels carrying amounts was reduced by about 7% of the estimated market value since its book value by the Management’s estimates exceeded the estimated DCF value.
As a result of the above mentioned, EBITDA (adjusted for value adjustments) reached HRK 97.2m, representing a decrease of 11.9% YoY. Such a result puts the EBITDA margin at 40.3%.
Going further down the P&L, the company recorded an operating loss of HRK 11.3m, mostly due to the aforementioned vessel impairment coupled with a decrease in operating revenues. The net loss was further widened by a net financial loss of HRK -20.4m. Therefore, net loss for the period amounted to HRK 31.68m, compared to a profit of HRK 23.34m in 2019.
We have recently published an overview of the MR Tanker Market, which you can find here.
In 2020, Kraš recorded a decrease in sales of 4.7%, an increase in EBITDA of 17.9% and an increase in net profit of 31.6%.
In 2020, Kraš recorded a decrease in sales of 4.7% YoY, which was compensated with a higher other operating income. As a result, operating revenue remained flat YoY at HRK 1.03bn. On the domestic market, Kraš recorded a decrease in sales of 5.1% (to HRK 529.4m). Meanwhile, on the foreign markets the company noted a decrease of 4.1% (to HRK 444.6m).
Operating expenses noted a slight decrease of 0.6% YoY, amounting to HRK 1bn. Of that, material costs increased by 3.5% or HRK 20.2m, which was compensated by a sharp decrease in employee expenses by 16.2%. As a result of the above mentioned, EBITDA increased by 17.9% to HRK 85.76bn. Such a result show also an improvement of EBITDA margin by 1.3 p.p. to 8.3%.
Going further down the P&L, operating profit increased by 27%, reaching HRK 32.5m. This puts EBIT margin at 3.1% (+0.6 p.p. YoY). The net financial result of HRK -6.6m (compared to HRK -2.2m) slightly weighted down the company’s earnings before tax. The higher net financial loss almost entirely came due to higher FX losses.
In 2020, Kraš recorded an increase of net profit by 31.6%, to HRK 25.2m.