This week we have seen March inflation data for several European countries that showed inflation is accelerating further reaching levels which have not been seen in a couple of decades. Most of the inflation came from energy although higher energy prices for longer are being included in the price of all goods and services. In this article provide more details on the data published this week and what are the consequences on financial markets.
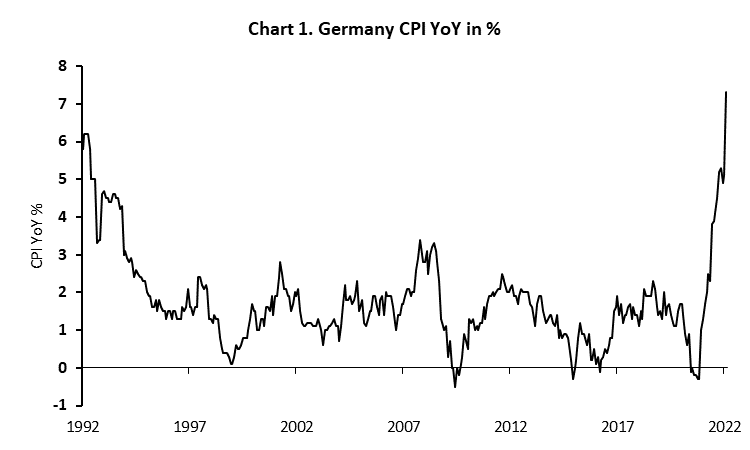
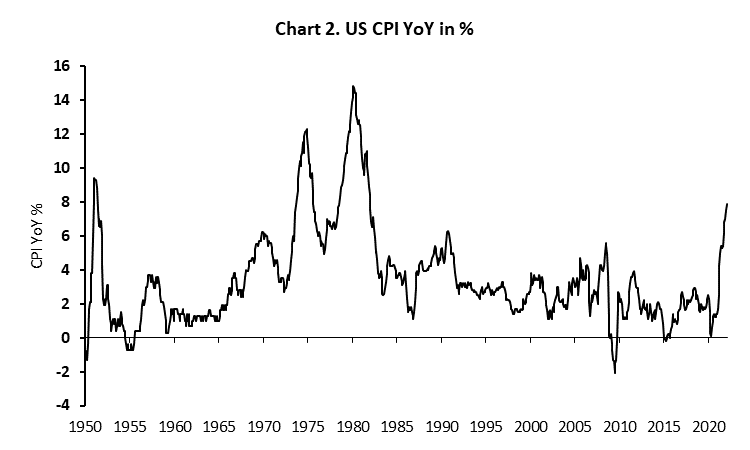
On Wednesday, the Spanish statistical office was the first one to publish flash estimate of March’s inflation which showed that CPI in the country stood at 9.8% YoY compared to 7.6% in February and way above all expectations on BBG (consensus 8.0%). Although most of the increase could be explained by higher energy costs according to the statistical office, core inflation also increased, from 3.0% in February to 3.4% in March. On the same day, Destatis informed us that German inflation also accelerated in March, to 7.3% YoY while yesterday we saw data from France and Italy which followed the trend. This means that inflation in Europe is now at the highest level in at least 30 years that we have comparable data and extrapolating energy cost for another month show that we could see even stronger YoY levels due to more and more goods and services calculating in for more expensive inputs.
Talking about energy costs, March’s data for Germany showed that energy inflation shot up in March to 39.5% from 22.5% in February. However, we are still in no man’s land in talks with Russia on energy and everything became even more complicated once Russian president decided that from now on European countries should pay for Russian oil and gas with Russian rubles. Officials from Germany and other EU countries denied paying in rubles due to a breach of contracts so we still do not know what will happen once current contracts end. Furthermore, Russian invasion of Ukraine continued for the second month and every additional day of war moves us away from any agreement between Russia and the west going forward. So, the only thing that is currently for sure is that prices of oil and gas will continue showing extreme volatility for some time. This means that producers will have difficulties with pricing their goods and will increase prices to customers in the maximum extent which was showed on the latest PPI from EU countries that were above 30% YoY in March. European TTF natural gas is currently trading around EUR 110 per MWh while Brent oil stands at USD 107 per barrel which is 20% below March’s highs but still some 100% above the average level in the last five years.
Inflation is becoming a real challenge for the economy it was shown this week also when we got European business and consumer survey which stood at the 12-month lows while consumer confidence index fell to the lowest level since April 2020 when we were closed in our homes. This means that economic slowdown is practically inevitable while yield curves are showing that we are close to another recession, but with high inflation rates. This further complicates the problem for central banks although we saw that high inflation is their priority number one which makes sense, but the question is for how long and how much of the economic downfall could central banks tolerate before they take the blame for both i.e., inflation and recession.
What do markets have to say about the current situation? Obviously, bond yields are rising at the fastest pace we have seen in years, but they are still low if you compare them with inflation as real rates are deeply negative. This week we have seen, EUR 2y benchmark coming to positive territory for the first time since 2014, while 10Y overjumped 70bps for a short period of time. On the other side of the Atlantic, we have seen 2s10s inverting intraday, with 2Y paper being at 2.40%.
Source: Bloomberg, InterCapital
Source: Bloomberg, InterCapital
The shareholders of Hidroelectrica, the Romanian water-power producer, have approved the initial public offering for a stake of up to 19.94%.
During the GSM of Hidroelectrica held yesterday, 31 March 2022, the shareholders have approved the initiation of the listing of the Company’s shares on the BVB following a public offering of the Company’s shares held by the Fondul Proprietatea fund.
The Fund currently holds 19.94% of the issued share capital of Hidroelectrica, representing 66.15% of the Fund’s NAV as of the end of February 2022. Fondul Proprietatea, which intends to sell a minimum stake of 15% in Hidroelectrica (from the aforementioned 19.94%), puts the value of the 15% stake at EUR 1.37bn. The remaining 80% of the stake in Hidroelectrica is held by the government of Romania.
Hidroelectrica, a company that operates 209 hydro-power stations, with a total installed capacity of 6.482 MW, as well as 108 MW in the Crucea-based wind park, expects 2022 net profit to amount to RON 2.9bn (EUR 586.2m), and sales to amount to RON 6.6bn (EUR 1.33bn).
Compared to January 2021, when pandemic measures were more strict and the economy was still in recovery, the industrial turnover increase amounted to 15.7% YoY. On an MoM basis, this increase amounted to 5.5%.
The Croatian Bureau of Statistics has published its latest report on the industrial turnover in Croatia for January 2022. According to the report, the total seasonally and working-day adjusted industrial turnover increased by 5.5% compared to the previous month. Compared to January 2021, this increase amounted to 15.7% YoY. The increase on a YoY basis can be attributed to the fact that during the winter of 2021, most of the COVID-19 related measures were still in place, which increased the number of people working from home, and in general, decreased industrial activity.
Meanwhile, if we compared the industrial turnover by the destination of the markets, it increased by 1.7% MoM and 11.6% YoY in the domestic market, and 2.2% MoM and 24.5% YoY in the non-domestic market. Breaking down the index according to product types shows that Energy recorded the largest increase, growing by 51.2% YoY, followed by Intermediate goods with 21.2%, Capital goods with 14.1%, Non-durable consumer goods by 11.5%, and Durable consumer goods by 7% YoY.
On an MoM basis, the story is similar, with Energy increasing the most, at 67.8%, followed by Durable consumer goods with 15.3%, Intermediate goods with 9.5%, Non-durable consumer goods with 6.6%, and Capital goods, with 1.9%.
We also decided to look at how the benchmark for the industry in Croatia, the CROBEXindu index, as well as its constituents, performed since the beginning of the year.
YTD performance of CROBEXindu
As can be seen from the graph above, the CROBEXindu index increased by 3.1% since the beginning of the year, currently standing at 1.156,84 points. Looking at how well the companies which comprised the index performed, we can see that Viktor Lenac experienced the largest increase, growing by 35.6% YTD. Following them, we have Đuro Đaković, which increased by 20.6% YTD.
On the flip side, the largest decrease by far was recorded by AD Plastik, which lost 40.2% of its value since the beginning of the year. In fact, most of this decline came after the Russian invasion of Ukraine, as AD Plastik has app. 27% of its revenue in Russia. With the conflict continuing, AD Plastik will surely experience a decline in sales, as well as FX losses, as the rouble already depreciated compared to the euro and the dollar significantly since the beginning of the conflict. The remaining companies of the index increased/decreased by +/- 2% YTD.
YTD performance of CROBEXindu constituents (%)