Index performance wise, 2019 could be characterized as a successful year for the regional markets. How does this success compare to the previous years?
| wdt_ID | Index | Performance in 2019 |
|---|---|---|
| 1 | BET | 35,13 |
| 2 | BUX | 17,74 |
| 3 | ATX | 16,07 |
| 4 | CROBEX | 15,36 |
| 5 | SBITOP | 15,03 |
| 6 | BELEX15 | 5,25 |
In 2019, almost all regional markets recorded double-digit growth of their respective main index, which can be seen in the table above. Such a performance raises a couple of question such as:
- Is such a performance of regional indices an outlier?
- How often did the indices observe similar performance?
- Are we going to observe the continuation of the positive sentiment in the region?
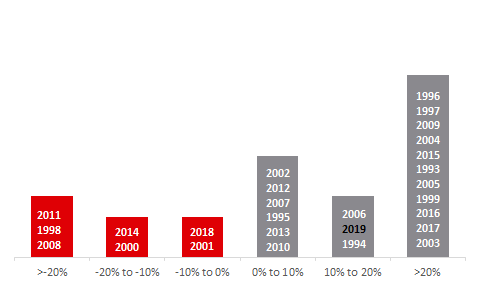
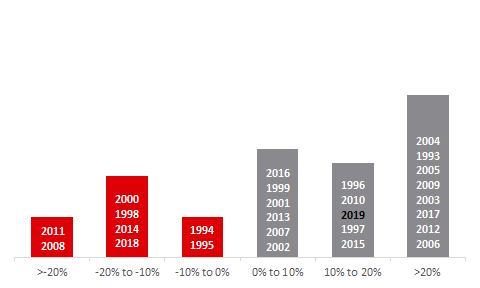
To answer the first two questions we decided to present you with a graphical overview of the index performance throughout time. The following graphs show yearly return of each index on a spectrum from >-20% to >+20%.
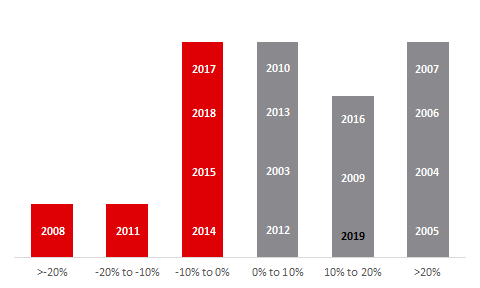
CROBEX (2003 – 2019)
SBITOP (2004 – 2019)
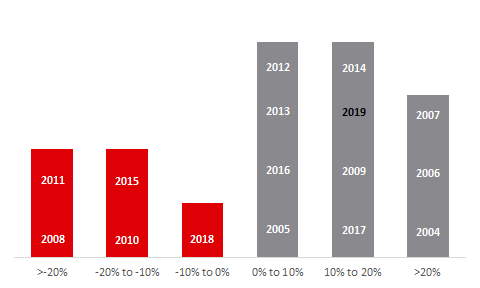
Source: Bloomberg, InterCapital Research
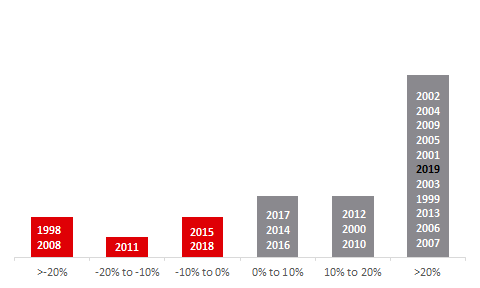
BET (1998 – 2019)
BELEX15 (2006 – 2019)
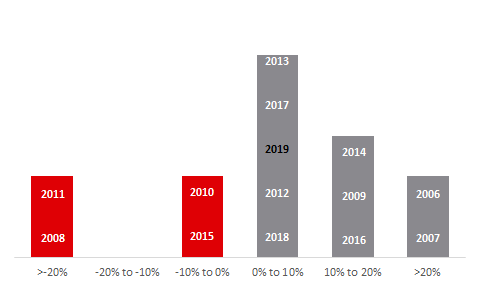
Source: Bloomberg, InterCapital Research
BUX (1993 – 2019)
ATX (1993 – 2019)
Source: Bloomberg, InterCapital Research