Market corrections are a normal and desirable occurrence, but the question is: should you buy the dip? Today, we dive into the historical performance of the S&P 500 and analyze its movements following Fed interest rate cuts.
In August, we witnessed increased market volatility as the S&P 500 dropped 6% over three days. However, the sell-off was short-lived, with markets rebounding by mid-month, driven by the prospect of lower interest rates and a solid Q2 earnings season. Notably, this year has been atypical for the relative calm of US stocks. So far, only five days have seen daily return changes exceeding 2% (+ or -), and interestingly, four of those five days occurred in the third quarter.
S&P 500 corrections since 1928 – YTD 2024
Source: Ned Davis Research
The graph above illustrates that market corrections are a regular feature of stock markets, specifically focusing on the frequency of corrections in the S&P 500 index. As expected, while larger market declines are less common, smaller dips and corrections occur more frequently, highlighting that such fluctuations are a natural part of market behavior.
The most frequent type of correction, as depicted in the graph, are dips, representing declines of 3-5%, which occur approximately 7.2 times per year on average. These are followed by mild and moderate corrections, with more severe declines happening far less often and mostly in times of global crises and economic shocks. Interestingly, despite the market’s usual rhythm, we have yet to experience a dip of more than 3% this year. However, with volatility beginning to rise, the prevailing calm may be converging toward more typical market patterns, suggesting that corrections could still be on the horizon as the year progresses. Additionally, from 1928 through 2023, the S&P 500 experienced a drawdown of 5% or worse in 94% of the years analyzed.
The real question isn’t whether market corrections will happen, but whether you should buy the dip when they inevitably occur. As the graph below demonstrates, the S&P 500 rebounded the following day after a drop of more than 2% in 54.5% of the cases analyzed. This highlights the importance of factoring in short-term market movements when shaping an investment strategy during periods of volatility. However, the focus should remain on long-term investing, as attempting to time the market is notoriously difficult and highly risky – an idea supported by numerous academic studies and common sense.
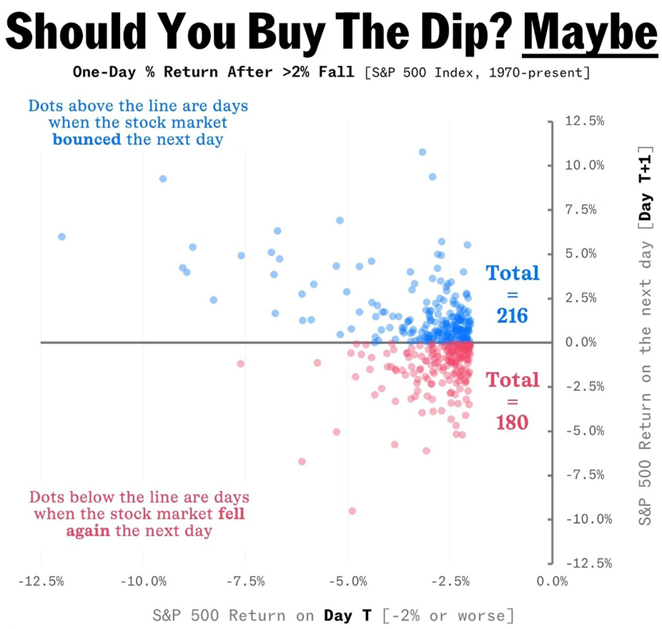
Source: FactSet
Let’s turn our attention to S&P 500 returns following the recent 50 bps rate cut by the Fed, which also signaled two additional cuts by year-end as part of a strategy aimed at achieving a soft landing. This decision was met with mixed market sentiment due to several factors.
First, the analysts’ consensus had anticipated a more modest 25 bps cut. While a 50 bps reduction was plausible, it was viewed by many as overly aggressive and somewhat unexpected. The initial market pullback, driven by cautious reactions to the Fed’s decision, was brief. Stocks quickly recovered in after-hours trading as investors placed hope in the natural progression of inflation toward the 2% target and the successful realization of a soft landing.
Additionally, global markets displayed mixed sentiment in the previous week awaiting rate decisions from the Bank of England and the Bank of Japan, adding an extra layer of uncertainty to the overall outlook. However, as the week came to a close, US stocks experienced a post-Fed rally, buoyed by positive jobs data.
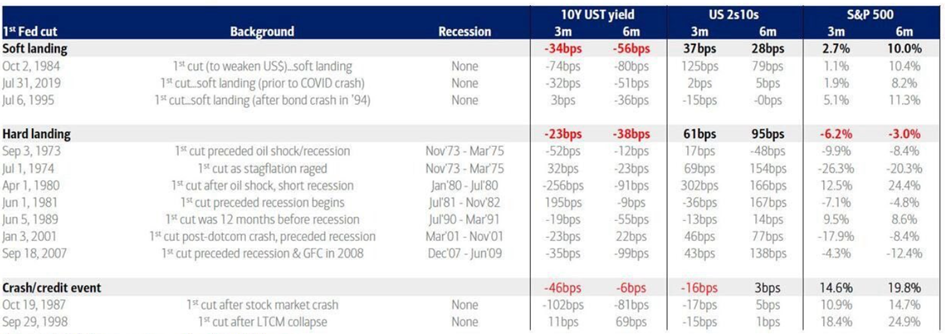
Source: BofA Global Investment Strategy
Historically, after the first rate cut, short-term market movements have tended to be negative, with the S&P 500 experiencing an average decline of 1.1% in the first three months following the cut. However, over longer periods the trend reverses – six months post-cut the index averages a 4.4% gain, and after one year the average gain rises to 4.9%.
When we focus solely on periods that resulted in a soft landing which the Fed expects – such as 1984, 1995, and 2019 – the outlook is notably more positive. In these cases, the S&P 500 posted an average gain of 2.7% over the first three months and 10% over six months.
On the other hand, if a soft landing is not achieved, and a hard landing occurs, the picture is significantly bleaker. In such scenarios, the market saw an average decline of 6.2% in the first three months and 3% over six months.
Overall, while market corrections and volatility may cause short-term concern, history demonstrates that they are a natural part of the market’s behavior. Over the long term, the S&P 500 has consistently rebounded. The recent rate cut by the Fed, coupled with the expected additional cuts, upcoming presidential elections, and other contributing factors, has sparked mixed sentiment. However, the outlook remains cautiously optimistic, particularly if a soft landing is achieved. Historical data suggests that after initial declines, markets tend to recover, with significant gains typically seen over six months to a year following rate cuts.
That said, the risk of a hard landing still looms, emphasizing the importance of maintaining a long-term investment strategy rather than attempting to time the market. As always, diversification and patience are crucial in navigating periods of uncertainty and capitalizing on potential opportunities.