September looks like a month when central banks bring on their best performance in what is now a global crusade against inflation. Accelerated US QT starts today, we have ECB GC next week and everything left to doubt is whether they raise by 50bps or 75bps. A lot of hawkish news is already being priced in. Except for one we have all been waiting for – that consumer inflation has peaked. How do we look at these things – read in our brief research piece.
United States’ Federal Reserve’s accelerated pace of balance sheet reduction (popularly called quantitative tightening, or QT) starts today and it’s worth looking over our shoulder to check some of the facts. First of all, FED has a balance sheet of historically unprecedented size totaling 8.8tn USD (link). Elevated US inflation figures motivated FOMC officials to accelerate the pace of interest rate hikes as well as the pace of balance sheet reduction, so on June 01st QT started at a pace of 47.5bn USD; the breakup of these were 30bn USD of USTs espoused by additional 17.5bn USD of mortgage-backed securities. This is scheduled to increase today to 95bn USD (60bn USD of USTs and 35bn USD of MBS). Notice this is the fastest QT pace ever, but it corresponds to largest FED balance sheet ever, as well as consumer inflation revisiting multi-decade highs.
Before we proceed further, some myths should be dismantled. First of all, FED has a much shorter duration of its bond portfolio compared to the 2017-2019 tightening period, which is an end result of buying huge sums of shorter T bills during the pandemic in order to create market liquidity and stabilize the financial system. If you think otherwise, you should check the composition of FED’s SOMA – System Open Market Account (link). A popular myth going around these days is that interest rate rises are expected to affect the shorter part of the curve, while QT is expected to raise longer-term interest rates, but in fact, both tools target the front part of the yield curve. And oh, it gets better – last time FED did a QT, the maximum pace (50bn USD per month) was reached in the fall of 2018. Let’s take a look at how US 10 year behaved after that:
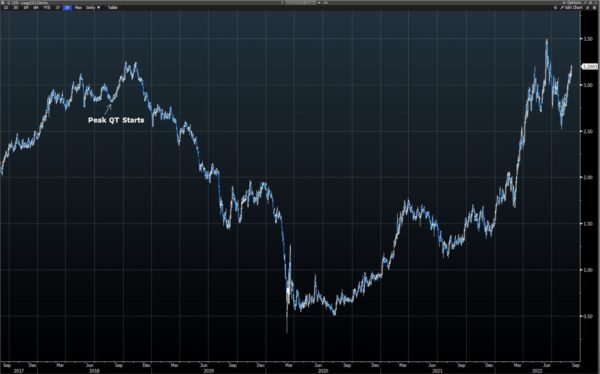
Source: Bloomberg
Notice that after the initial rate rise UST yields went down from 3.20% to sub-2.00% before the pandemic began. One of the key differences between now and then is that in the 2017-2019 tightening period the US curve inverted after the peak QT pace had been reached, while this time the curve is already inverted. This is just one of the many differences, apart from the obvious fact that this time we’re also troubled by staggering inflation rates.
What can we expect going forward? It’s obvious that ECB is calling US FED’s bets and that once Washington started raising aggressively, Frankfurt had to follow suit. Notice that the ECB is doing no QT of its own, but it’s troubled by staggering inflation rates and huge disruptions in energy supplies. Now, we have mentioned a couple of times that weakening EUR versus the greenback is part of the problem of why EU inflation rates are looking so grim. In other words, with no QT in sight in Europe, Frankfurt has to call FED’s bets at least and match the anticipated September rate hike. Notice that in September ECB has an opening act, meaning that this time ECB officials have to act in anticipation of the US FOMC decisions (until now they had the luxury of waiting for the FED to make a move and then react). This is the reason why it’s very, very likely the ECB would raise rates by 75bps at the September 08th meeting. EONIA swaps from Bloomberg’s WIRP EZ function price a 73% probability of 75bps hike in one week’s time:
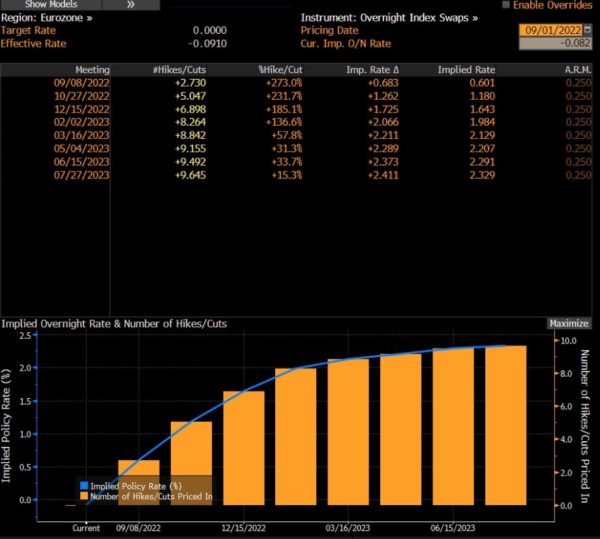
Source: Bloomberg
The September 21st FOMC meeting is in our opinion still too close to call, but as you can see the market is leaning in the 75bps direction. FED is data-dependent, but the rhetoric delivered on Jackson Hole is quite hawkish. Markets are expecting a 75bps hike as well, but with a 70% probability:
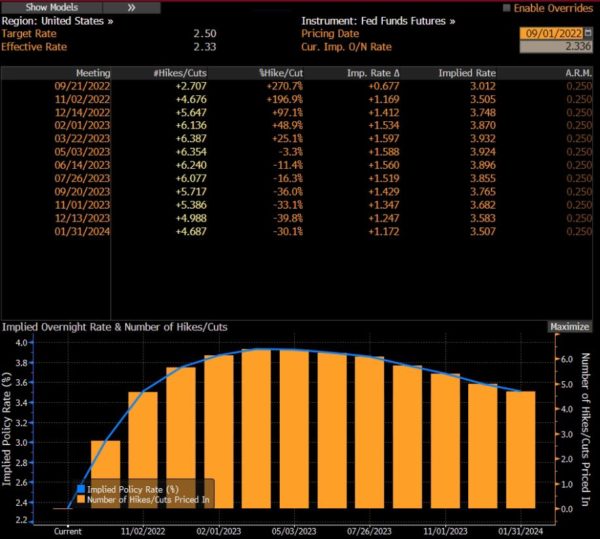
Source: Bloomberg
What does all that mean for Croatian bonds? Well, it’s obvious that eurobond yields went up, you don’t need us to tell you that. But the spreads have so far been well behaved and we haven’t seen anybody lucky enough to buy CROATI€ above 195bps spread to Germany. Lately, every nugget of information we have received on the desk has been blowing in the horn of the EU recession – just this morning FT reported that „German factories halt output after Russia’s alarming Squeeze on gas“. The good thing from European perspective is that China has maintained Covid curbs in main industrial cities and accelerated the production of coal, the end result being that China is now exporting LNG (and you thought you saw everything!). This unfolding of events, augmented by the fact that European natural storage is getting nearly full, managed to ease TTF natural gas forward price, but we’re still struggling with elevated electricity prices across the board. Why are we telling you this under the “Croatian international eurobond” paragraph – it’s simply because we have received requests from the client side about our analysis of how Croatian bond spreads would behave in case the EU recession takes hold? Remember, things have indeed changed – Croatia now has a better credit rating than Italy by one notch. Also, cash positions on some of the large institutional asset managers look ample, to say the least.
Is it possible that the EU recession might bring about lower benchmark yields and higher CROATI€ spreads? Yes, it’s possible. But let’s take a few more weeks to think about this scenario, as well as a plethora of events taking place on a global stage.
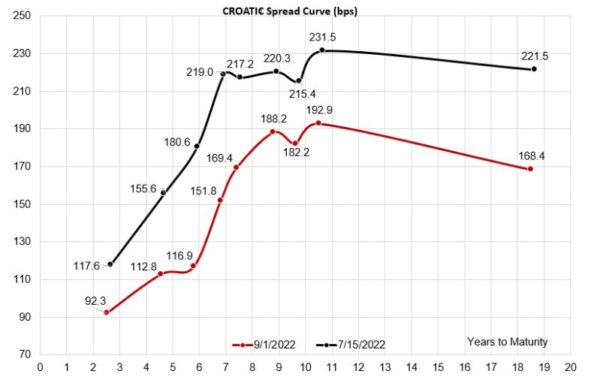
Source: Bloomberg