With the coronavirus pandemic skewing CAPEX and acquisition plans of many companies, we decide to take a closer look at the global M&A market in order to see what impact did the pandemic have on the value and volume of deals.
Although the total deal value recorded in Q1 2020 was the lowest quarterly result since 2014, the effect of the COVID-19 pandemic was just starting to show. Therefore, it’s unsurprising that deal volume dropped from 4,308 deals in Q1 2020 to 2,630 in Q2 2020. Meanwhile deal values plummeted to USD 308.9bn from USD 592.6bn in the previous quarter.
When comparing H1 2020 to H1 2019, deal volume fell 32% (from 10,155 to 6,938 transactions), while deal values declined 52.7% (from USD 1.9tn to USD 901.6bn). Such decline can only be compared to the sudden drop witnessed back in 2008 and 2009. However, despite many investors comparing the global financial crisis to the one caused by COVID-19, the latter one generated it’s on unique set of challenges for companies and investors worldwide.
Global Deal Value Quarterly Breakdown (USD bn)
Regional disparities
Even though COVID-19 has turned into a global pandemic with countries across the world being shaken up by its effect, impact on M&A wasn’t so evenly distributed.
First to be impacted by the virus, China saw the least impact on its M&A activity. According to Mergermarket the number of deals decreased by just 7% YoY, while deal values fell 20.1% (from USD 135.6bn to USD 108.3bn). China experienced the earliest onset of—and recovery from— the virus, providing a hopeful note that as other countries and regions recover, they too will show an improving deal environment. Resurgences of COVID-19 could constrain the upside, however. On the flip side, the Americas, dominated by the US, were the biggest decliner. Its share of global M&A by value declined to 33.4% in 2020 compared to 52.8% in 2019. Not only did the lockdown impact economic productivity, but also the US is facing high levels of political uncertainty from the looming presidential election and widespread, large-scale demonstrations and protests. With the falloff in US activity, the rest of the world saw their global market share increase. Europe (with a 32.3% market share) slightly edged out Asia (27.7%) in seeing the largest market share gains.
Industry Breakdown
To see just how different the recent crisis is from the one witnessed a little more than a decade ago one can just glimpse the chart showing global deal value broken down into sectors. As presented on the chart, the industry with the second highest sum of deal values was the financial services sector. Even accounting for a sizable fall in deal count, the Financial Services sector more than doubled its global market share to 17.1%. Furthermore, six of the largest financial services transactions announced in H1 2020 are investing or banking related, including Morgan Stanley’s USD 13bn bid for ETrade Financial, Kuwait Finance House’s USD 9.8bn offer for Ahli United Bank, and Franklin Resources USD 5.4bn bid for Legg Mason. Meanwhile, Aon’s USD 35.6bn plan to merge with Willis Towers Watson is an example of one the few large transactions that has managed to move forward.
Global Deal Value Breakdown by Sector (USD bn)
Source: S&P, InterCapital Research
Unique Traits
One of the unique traits witnessed during the recent crisis is the strong debt raising. While M&A deals have decreased sharply, global leveraged loans and high yield bond issuance reached more than USD 1tn in the first half of the 2020, with more than 44% taking place in Q2 2020, according to Debtwire. It seams that companies have been in a race to restructure older debt, pay down bank lines and raise cash to weather the recession. However, this brings in a completely new set of problems. With debt being at such high levels, one has to ask themselves what the quality of the debtholders is and are they able to repay such huge amounts in an uncertain environment. According to S&P Global, the number of potential debt downgrades is at an all-time high. The warning does not mean a company will be downgraded, but when a debt rating is cut, it can mean it becomes more expensive to issue debt and yields go higher. Note that yields move opposite to price. According to S&P there are now 1,287 issuers on the potential downgrade list, including some with the highest AAA rating. Note that the number surpassed the previous record of 1,028 from April 2009.
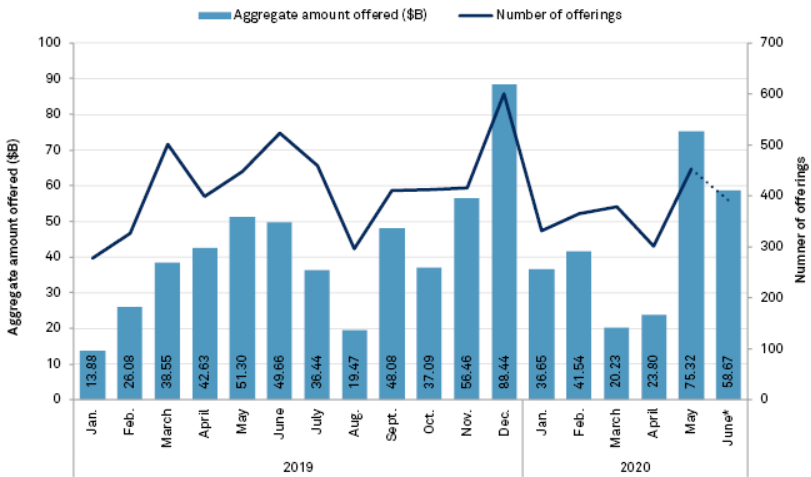
Meanwhile, despite the uncertainties surrounding the COVID-19 pandemic this hasn’t stopped new equity issuance. Equity capital market issuance has surged in the second quarter of 2020 versus the prior three months as global volumes hit a year-to-date high in May and continued to grow in June. With markets on the recovery after the big drop it seams that companies capitalized on a stock market rally fuelled by hopes that the COVID-19 pandemic is subsiding.
Equity capital market issuance
Source: S&P Global