Financial markets often exhibit moves that sometimes defy reason itself – or do they? This time we seek to explain the recent rise in SEE Eurobond yields, which was observed even on the countries with good fundamentals (such as Croatia). The explanation behind it? Find out in this brief research piece.
It’s been ten days since Fitch gave a nod to Croatian sovereign rating and raised it by one notch to BBB, the best credit rating the country has ever had. Moreover, the outlook was set at positive, signalling that at least one more rating upgrade might be just around the corner. With the current standing, Croatia currently has the same rating as Hungary (last update September 24th) and Bulgaria (last update October 09th, 2020). But here’s the deal – both countries are still traded at significantly tighter spreads compared to Croatia. Let’s compare the three Eurobonds with roughly the same maturity: BGARIA 0.375 09/23/30€ is traded at 0.57%-0.50% (YTM bid-ask), REPHUN 0.5 11/18/30€ at 0.72%-0.65%, while CROATI 2.75 01/27/30€ at 1.01%-0.96%, believe it or not. Have the bond markets been informed about the rating upgrade at all?
This has nothing to do with the rating, but it might have to do with something else instead. Let’s take a look at the way Croatian yield curve has behaved in the last twelve days:

In spite of the rating upgrade and although this is the best credit rating Croatia has ever had in thirty years of independence, the yield attributed to CROATI 2.75 01/27/30€ moved as much as 15bps up looking at mid-vs-mid (i. e. from 0.82% to 0.97%). The most liquid paper on the curve is CROATI 1.5 06/17/2031€, which printed a 17bps increase from 0.99% to 1.16%. So the move up was distributed along the curve with longer paper taking heavier beating. To make matters even worse, credit spreads widened, as depicted on the following chart. The spread on CROATI 1.5 06/17/2031€ moved up by as much as 30.8bps (from 132.8bps to 163.6bps), putting it on the widest level we have seen in at least a year.

The narrative at this point becomes quite counterintuitive: if the credit rating of the country improved, why are the Eurobonds traded wider than before the rating event? In order to explain this, we would have to look at overall market sentiment. First of all, take a look at Romanian yield curve change in the same time span. Notice the yields on ROMANI 2 01/28/2032€ (10.2 year duration point) moved up by about 18bps (from 2.28% to 2.46%), corresponding to the move in CROATI 1.5 06/17/2031€. Croatian and Romanian Eurobonds have been regarded as the only liquid Eurobonds among the SEE countries. It’s quite possible that the spread widening on CROATI and ROMANI might have been related to certain investors opening up short positions trying to benefit from the spread widening. But let’s take it step by step.

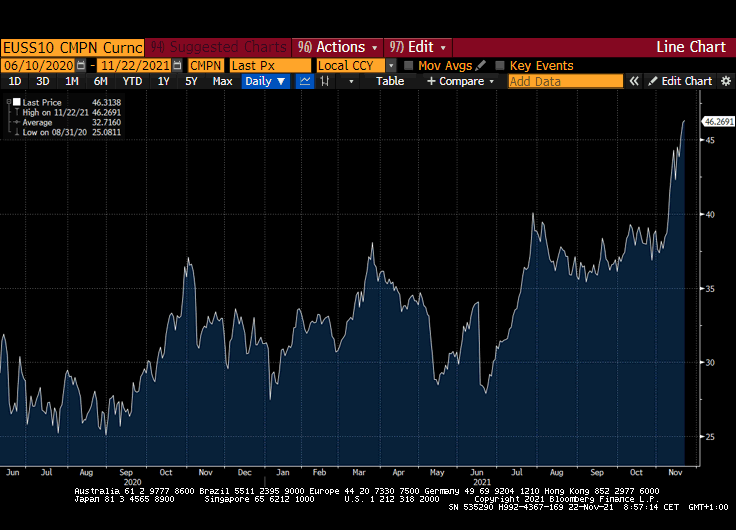
In the past week several desks and funds have been alarmed by the widening swap spreads. In the most basic case, it looks something like this:

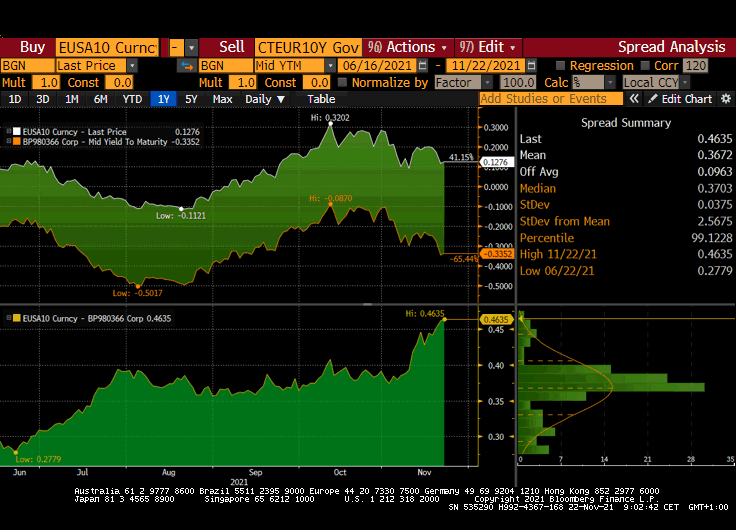
The chart depicted is taken directly from Bloomberg and shows generic EUR 10Y swap spread (EUSS10 CMPN Curncy). The spread is constructed by subtracting the 10Y German bond yield (CTEUR10Y Govt on BBG; the paper served as the underlying is DBR 0 08/15/2031€), currently yielding -0.33% (this is exactly the same yield behind GDBR10 ticker as well), from the10Y EUR mid swap (EUSA10 Curncy on BBG). The difference between the two is depicted on the chart below the paragraph and it’s quite visible that the widening EUR 10Y swap spread came from the sharp drop in German yields, which was not followed by an equivalent move in 10Y IRS. The instinct of the dealers tells us that when moves like this happen around the turn of the year, it usually means there’s a scarcity of the paper used for HQLA and the move might be reversed once the scarcity diminishes. This explains at least half of the move up on CROATI and ROMANI G-spreads.

What about the other half? Anecdotal evidence from primary markets shows that investors are increasingly reluctant do place large bids in the context of possible widening spreads. In the first two days of last week, placements of Bayern LB and Commerzbank were thinly subscribed. By the end of the week, Albania was doing a 10Y placement and although it was offered at a considerable concession (3.75% YTM), in the end the deal was 1.8x oversubscribed (1.2bn EUR book versus 650mm EUR placement) and the paper is bid 5 cents above reoffer in the grey market. Albania is tricky because it has no visible peer on such a long duration to do a more precise valuation, while at the same time it’s no core EM country and it’s not really involved in any indices.
On primary auctions many investors place hedge beds, so if the benchmark moves in the opposite direction and the main instrument treads water, investors basically lose money on the overall position. If the spread widening comes from paper scarcity we have described in the previous paragraph, then the main asset should go well in the time ahead. The lack of direction on benchmark Bunds might be a signal for some of the investors not to load up on new issues. The apathy observed on primary auctions might be a signal of much wider reluctance to enter long positions on risker assets.
Back to SEE international bonds – the move observed on ROMANI and CROATI was also clearly visible on MONTEN 2.875 12/16/27€ which is now traded wider than Turkey. A couple of dealers from London explained the spread move up on ROMANI, CROATI and MONTEN as connected to Chinese property sector travails, which threaten to spill over into liquid EMs. This is plausible, but it appears as solution chasing the problem. What is more likely is that certain offshore investors are betting on rise in interest rates and consequential rise in spreads by selling uncovered liquid bonds – if you want to do that, you sell CROATI and ROMANI, not REPHUN or BGARIA, because in the end you have to close your position somehow and you can’t do that efficiently on a thinly traded paper. From this perspective, liquidity can be detrimental to tighter spreads.
If we could squeeze all of this in one simple sentence it would be: Croatian credit profile is improving, but the liquid paper attracts short sellers. Let’s see if they get burned into year end.
Today we bring you our overview of the dividend yield of the Regional and Global indices in 2021.
Dividends are definitely an important factor when considering when making long-term investments, so it is worth comparing the dividend yields of global and regional equity indices in 2021.
Let’s first take a look at some of the biggest indices in the world, like the S&P 500 and Dow Jones. Both of these indices have across all the companies that compose them, a dividend yield of 1.28% and 1.73% respectively.
In Europe we looked at DAX, CAC, WIG20, ATX, IBEX, and FTSE100 indices. These. As visible from the graph below, FTSE100 noted the highest dividend yield (among European indices) of 3.9%, followed by IBEX (2.7%).
Ending our story in the SEE region, we looked at CROBEX10 and SBITOP indices. These indices achieved a dividend yield of 2.5% and 4.1% respectively. Considering that value stocks tend to have a higher dividend yield, such a yield in 2021 does not come as a surprise. We also note that SBITOP did not only deliver the highest dividend yield in 2021, but also showed the highest (price) increase as well on a YTD basis.
Dividend Yield Comparison (%, 2021)
