Yesterday’s US headline CPI print at +7.0 YoY was reminiscent of the 1980s and that’s why today research pieces are packed with black and white photos of Margaret Thatcher and Ronald Reagan. 80s are back, at least if you look at the CPI print! As one FICC dealer coming from Eastern Europe so eloquently put it: “I don’t mind repeating the 1980s, as long as we don’t have to repeat the 1990s“. Jokes aside, Powell’s Senate hearing coincided with the highest CPI print in 40 years, but still rates futures made a modest bounce back instead of moving down. Was that a dead cat bounce on rates futures, or we see more in that story? And how are CROATI/ROMANIs doing in an environment like this? Find out in this brief research piece.
Yesterday US headline CPI came at +7.0% YoY (core @ +5.4% YoY), spot on the market expectations and just a hair’s breadth stronger compared to December prints (headline @ +6.8% YoY, core @ +4.9% YoY). This is still the highest single CPI print since at least mid-1982 and naturally caused a lot of commotion, especially because the inflation print had this rare coincidence of happening right in the midst of Jerome Powell’s nomination hearing. Translated in simple English: the biggest inflation print in 40 years came about the same time Powell was going through a job interview and part of his job is to keep inflation at bay while depressing unemployment rates at the same (with December reading @ 3.9%, these look quite depressed). Although this job interview (the correct expression is “the Committee of Banking, Housing, and Urban Affaires’ Open Session to conduct a hearing on the nomination of …”, but you got the point) was just a technicality since Powell has bipartisan support and would definitely be reappointed, the media attention and the pending US midterms meant that new/old FED Chairman hat to go strong on the measures to contain inflation. Basically he told the lawmakers exactly what they needed to hear: high inflation was a “severe threat” to a full economic recovery and FED is prepared to raise interest rates because at this point in time the recovery no longer needs the support. FED officials have penciled in three interest rate hikes (markets believe them and with implied Dec-22 FED fund futures yield @ 0.90%), while top hawk Bullard sees a fourth one coming along as well. More importantly, reducing the balance sheet at the end of the year is also in the cards and speaking about QT, balance sheet reduction is the real McCoy.
That’s all cool, but why did the rates go lower after the hearing? Was that a dead cat bounce – i.e. traders who were short rates heard what they needed to hear and started to close part of their shorts, bringing TYA/RXA complex higher? It could be, but we would also like to point out what has happened on USD LIBOR futures over the past four trading sessions. The green chart represents USD LIBOR implied yields (implied yield = 100 – contract price) on January 06th, while the orange line depicts yesterday’s values.

There’s something you need to notice here: up to December 2024, the orange line is above the green one, spelling markets expect higher LIBOR rates in this period then they did four sessions ago. But after that the orange curve is below the green one. What does that mean? It means the markets are gradually pricing out a possible policy error (FED not acting soon enough, vouching for more rate hikes in the future) and expecting short-term rates in the future lower than they did before. For instance, September 2028 USD LIBOR expectations came down from 2.16% to 2.08% and it’s quite likely all of this translated into slightly higher TYA/RXA complex. Again, this is just an interpretation for clarification, not a dogma to worship.

What’s going on with CROATIs? As a matter of fact, we have seen a lot of buying interest on CROATI 5.5 04/04/2023$ and CROATI 6 01/26/2024$ at 1.07% YTM and 1.35% YTM, respectively. Yes, institutional investors are buying and at one point in time throughout yesterday’s trading session nobody was really willing to offer more CROATI$ even at a short offer. CROATI€ were traded slightly lower in terms of prices, but the unavailability of assets to offer motivated on of the bulge bracket dealers to dub the situation “an assetless sell off”. Essentially it means the prices going down on the screen/ALLQ, but if you call the dealer and ask for 5mm EUR CROATI 1.5 06/17/2031€ offer, you’re either going to get a cold shoulder (“flat these, sorry mate”), or some incomprehensible explanation (“sorry, trader is off at lunch” at 10.00 AM GMT!). There is something worth thinking about – on the CROATI€ yield curves supplemented, we have compared yield/spread levels to the levels recorded at the depths of “Thanksgiving EM sell off”. If you don’t know what that is, please remember that omicron strain was first introduced urbi at orbi during the last trading week of November, igniting an EM sell off we were writing about. Throughout December 2022, much of the lost strength was recovered, but then came the Christmas rates sell off that started affecting CEE bonds in general from early January on. Nevertheless, it’s worth mentioning we see a lot of switching away from ROMANI€ and into virtually and CROATI€ investors could find, so it’s quite likely the spread widening to be contained this time.

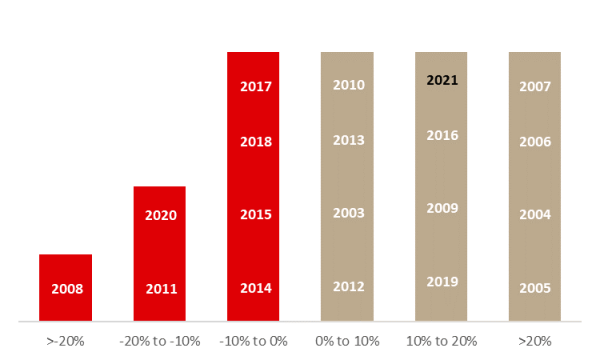
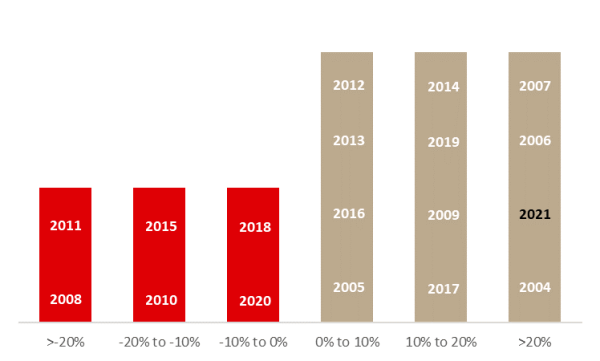
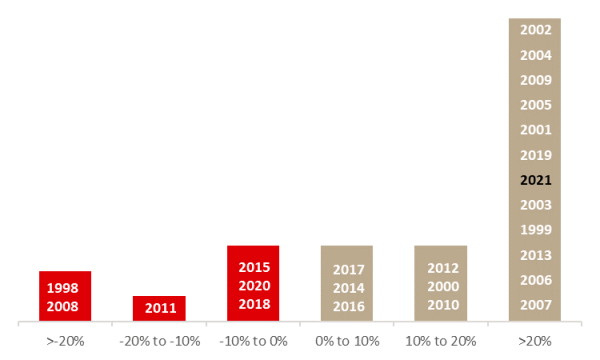
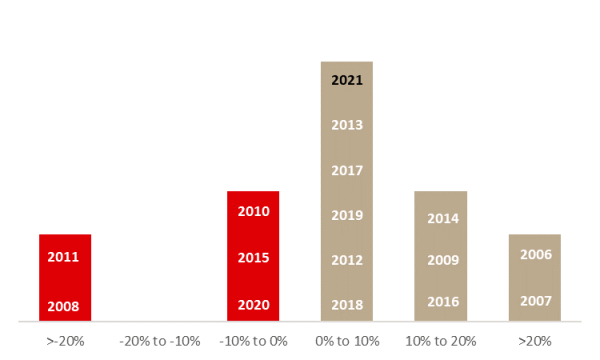
Performance of indices in 2021 can be characterized as a year of recovery for some, and exceptional growth for others. Today, we look at indices’ performance compared to previous years.
In 2021, all but 1 of the observed regional markets experienced double-digit growth, in what can be described as a very solid year of recovery and growth. Leading the way, we have the Slovenian market, whose largest index (SBITOP) grew by 39.8% in 2021, followed by the largest Austrian Index (ATX) with a growth of 38.9%. Next up, we have the largest Romanian Index, which increased by 33.2%, followed by CROBEX, the main Croatian index, which grew by 19.6%. Lastly, we have BELEX15, the largest index in Serbia, with an increase of 9.6% in 2021.
We decided to present you with this information with a graphical overview of how these indices performed throughout time. The graphs below represent yearly returns of each index, in a range from >-20% to >+20%.
CROBEX ( 2003 – 2021)
Source: Bloomberg, InterCapital Research
SBITOP (2004 – 2021)
Source: Bloomberg, InterCapital Research
BET (1998 – 2021)
Source: Bloomberg, InterCapital Research
BELEX15 (2007 – 2021)
Source: Bloomberg, InterCapital Research
ATX (1991 – 2021)
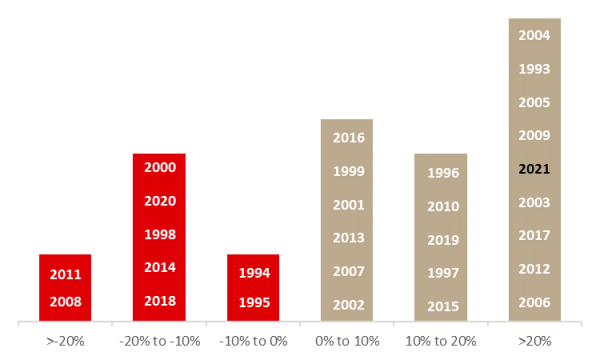
Source: Bloomberg, InterCapital Research
