In the past 2 months, EUAs have noted an increase of c. 50%, reaching at a point close to EUR 90/t, which opens up an important question – what is driving the latest EUA emissions frenzy? Where could the prices be heading next week? Find out in this brief article.
Back in August we published a blog titled “Introduction to emissions trading” in which we gave a brief overview of the emissions trading system in the EU. More specifically, in that blog we wrote the following: “if someone told you that a certain commodity surged by more than 1,000% in the last 5 years, chances are you might have not guessed that that particular commodity is EU carbon permits. Despite such a surge, these permits are still relatively uncharted territory for many investors”.
In the past 4 months, many things have taken a wild turn, as carbon permits noted a rapid increase in their popularity and consequently, their price. More specifically, EUA contract reached slightly below the EUR 90 mark at one point, noting a YTD increase of as much as 156%.
Price of EUAs under ETS (EUR/t)
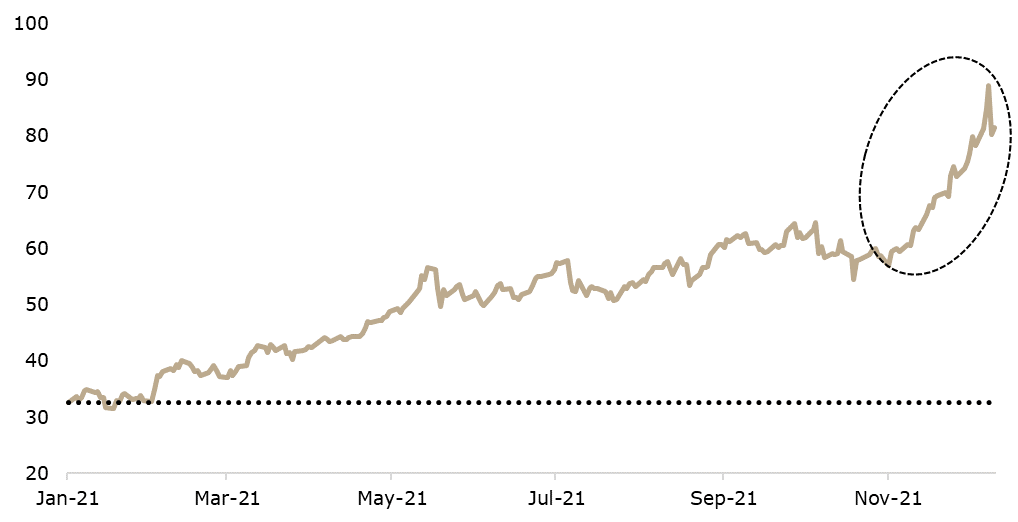
Source: Bloomberg, InterCapital Research
As noted in our previous blog, in a typical cap and trade program, a limit (“cap”) is set by a regulator, such as a government entity or supranational organization, on the total amount of specific GHG (such as CO2) that regulated entities (such as manufacturers or energy producers), may emit. The regulator then issues or sells emission allowances to the regulated entities when they emit less GHG than permitted by the cap.
The regulated entities may then buy and/or sell (“trade”) the emission allowances on the open market. As interestingly, such a system opens up another large space – the speculation on the movement of the price of these units for those who do not necessarily “need” the certificates.
The fact that the financial market participants, both retail and institutional, further got on the bandwagon since our last blog can be seen when looking at the trends in the carbon allowance based ETFs. More specifically, KraneShares Global Carbon ETF’s (ticker: KRBN) AUM has tripled in the last 4 months, reaching c. USD 1.6bn. To put things into a perspective, this makes KRBN the 11th largest commodity ETF in the world, which is quite impressive given that the ETF has been present on the market for just over a year.
Since then, we have seen an emergence of new Carbon based ETFs such as KEUA US, which solely tracks European Allowance futures, while CO2 LN offers investors a means of accessing the properties of physical EUAs.
In the past 2 months, EUAs have noted an increase of c. 50% (before seeing a drop recently), which opens up an important question – what is driving the latest EUA emissions frenzy? Are companies in need of the certificates currently on a buying spree? Well, the short answer is, no, we believe that this time the fundamental factors have taken a secondary place in the rise of the price of emission allowances. More specifically, it is probably driven by the speculation in the options market.
Gamma squeeze on EUAs?
Some analysts have suggested that the recent steep increase in EUAs can be seen as a gamma squeeze. To be specific, such scenario occurs when there is prevalent buying activity of short-dated call options for, in our case, EUAs. This can consequently create an upward spiral in which call buying triggers higher EUA prices, which results in more call buying and even higher EUA prices. Put simply, it seems that the delta hedging of market makers is driving the prices of EUAs significantly up, so the recent increase could be seen as mostly speculative in nature.
This poses an important question – why are financial institutions buying call options on allowances as if there is no tomorrow? Information from the market indicates that only a very small part of the demand arose as a need for hedging. Most of the interest in buying call options comes from speculative needs. At the time of writing, the total open interest of all call option owners between 80 EUR/MWh and 100 EUR/MWh was almost 80Mt, but it is worth noting that this position changes as the price changes.
Thus, in 2 days, (15th Dec) quarterly options on emission units (ICE Endex) mature and currently the most important prices are 70 EUR/t (14,740 options is the total position at this price), 75 EUR/t (13,772 options) and 80 EUR/t (16,442 options). If we add up the open positions, we will get the value of almost 45k options. In the current conditions, all these options will mature in the money, which means that all call option owners will get the right to buy emission units at prices specified in the contract (70 EUR/t, 75 EUR/t and 80 EUR/t).
What will happen next given that most call option holders have entered the position to earn a quick buck?
You guessed it, they will probably exit the position by selling the acquired units and this could put a downward pressure to the prices of EUAs. To put things into a perspective, each call option gives the owner the right to buy 1,000 emission positions, indicating an open interest of actually 45m units, or 45 Mt of carbon dioxide. These are just the three largest maturities, and at other prices there is a remainder of about 35Mt of emission units.
Take into account that by the end of the year, EU countries will sell about 23m units at auctions, bringing the total amount on offer to over 100m tons.
Who will buy all those EUAs? This is a question to which we are also eagerly waiting for an answer. On Thursday (9th Dec), the price of emission units fell by 10% (from 90 EUR to about 80 EUR) and this already served as a hint of events that could await us before the end of the year.