2022 has proven to be quite elusive when it comes to gains on the stock exchange, as inflation, interest rate hikes, extreme energy prices, and the war in Ukraine all put downward pressure on the equity markets across Europe and the world. This brief analysis will look at how some of the most significant regional, European, and US indices performed during this period.
Long-term investment into equity has historically proven always to be a prudent decision, as any periods of shocks and crisis only take a couple of quarters, to maybe a couple of years to resolve themselves. Compare that to periods of massive and prolonged growth that have historically squeezed themselves in between these periods, and then you can see that decision is justified. However, the last couple of years could be described as a real rollercoaster ride, with a pandemic coming and going, with stocks across the world jumping off a cliff in its wake, only to rise again, a couple of quarters later, and soar even higher than before.
In fact, most of the indices in the world reached their high point by the beginning of January 2022, despite the ongoing supply chain issues, the inflation starting to go from bad to worse, as well as the interest rate hikes announced by Fed, and subsequently later followed by other Central Banks across the world.
Like adding fuel to the fire, the Russian invasion of Ukraine sparked even more uncertainty and volatility, causing significant issues for European energy security. In this environment, nothing more could be expected than a decline in the equity markets, as they are usually the first ones to react to bad news, and continual worsening in the macroeconomic outlook just continues to diminish the investor confidence in the market and puts pressure on investing in riskier types of shares.
So having all of this in mind, how did select regional, European and global equity indices perform since the beginning of 2022?
YTD performance of select European and global indices, %
As can be seen in the figure above, the largest decline experienced in this period came from WIG (primary index on the Warsaw Stock Exchange), at 31%. Here we can see a couple of things happening at the same time; firstly, Poland is located right next to Ukraine, so any spillover or escalation of conflict will surely influence them as well. Secondly, Poland is hit hard by energy price pressures, especially in terms of oil&gas, leading to YoY inflation of 17.2% in September 2022. Secondly, considering that Poland has its own currency and is not part of the Eurozone, the National Bank of Poland (NBP) currently holds its interest rate at 6.75%. Both of these factors, as well as the prospect for further deterioration, are leading to negative investor sentiment, thus requiring higher returns in a period of high risk, driving the valuations of companies lower. Next up, we have NASDAQ 100, which declined by 29% YTD. This can be attributed to the fact that it is mainly composed of technology stocks, something that is referred to as “growth” stocks. Considering that growth stocks are hit especially hard in times of economic shocks, as well as the fact that interest rate hikes that the Fed has been and continues to pursue are having a massive negative impact on the valuations of these companies, and thus, a flight of investors from them.
Moving back to Europe, ATX declined by 28%, while BUX and SBITOP both declined by 22%. In this case, the strong dependence of both Hungary and Austria on Russian gas is putting a recession risk a lot higher than in some other countries, while also having a strong impact on current inflation rates, thus impacting the overall market. SBITOP is also similarly affected, although in this case, specific companies that are hit particularly hard by the current energy (Petrol) and geopolitical (Krka) environment declined severely, losing 27% of their value each, YTD. The largest decline, however, was experienced by NLB, which lost 29.7% of its value since the start of the year. Moving on, both DAX and S&P500 lost 21% of their value, while the Europe-wide STOXX 600 index lost 18% of its value.
Out of the remainder of the indices, only CROBEX and FTSE 100 lost less than 10% of their value, at 7% and 5%, respectively. Considering the number of energy companies in the FTSE 100, which benefited greatly from the current energy prices situation, the index’s performance is somewhat justified. However, considering the current hurdles that the BoE (Bank of England) has to go through to keep the financial system in check (of which you can read more here), a higher decline could be expected. Finally, in CROBEX’s case, the main cause of the low decline, however, is not something that would be considered good in times of economic expansion, but in this case, proves to be a cushion, and that is, the low liquidity on the Croatian equity markets.
Select indices performance per quarter (Q1 2017 – Q3 2022, %)
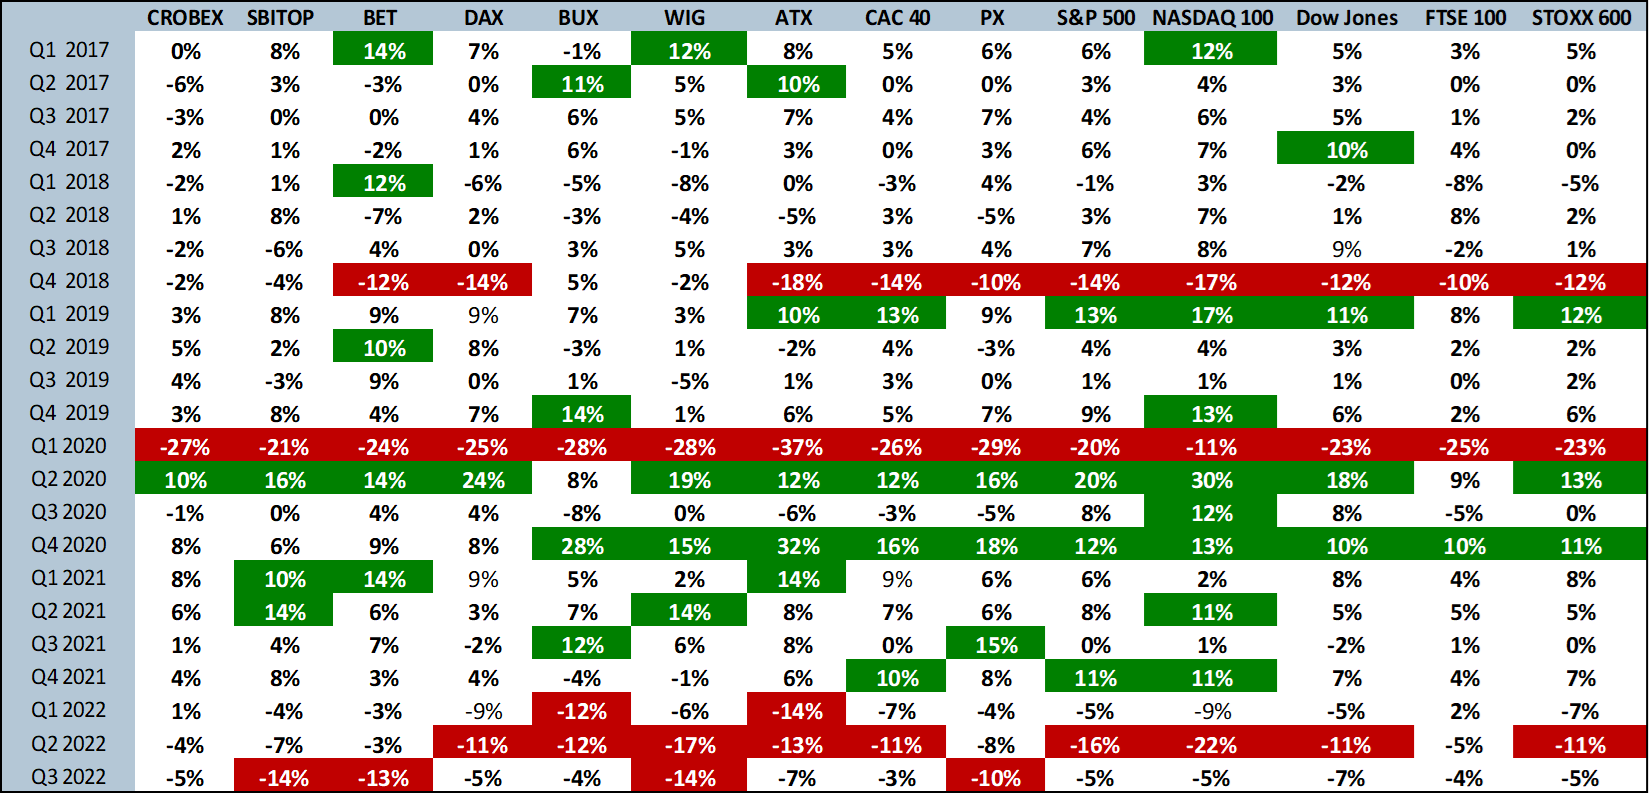
Source: Bloomberg, InterCapital Research
Moving on to the quarterly data, both Q2 and Q3 2022 experienced declines, with some indices losing a lot of their value during this period. For example, in Q2 2022, NASDAQ 100 lost 22% of its value, WIG lost 17% of its value, S&P 500 lost 16% of its value, while in Q3 2022, SBITOP and WIG lost 14% of their value each, respectively, while BET lost 13% of its value. What can be seen here is the fact that Q2 2022 was more heavily impacted, as is to be expected as it featured the escalation of conflict in Ukraine at the end of Q1 2022, the sanctions imposed on Russia, and the general macroeconomic situation deteriorating continually. This led to further deterioration of stock prices, and by extension, declines in indices by the end of Q3 2022.
In fact, to put things into perspective, we can look at the World Market Capitalization Index, an index that tracks the overall market capitalization on all world exchanges, excluding ETFs as well as companies with the double listing, so it can be used as a rough proxy for the overall capitalization on the markets. It should be noted that the index is consolidated in dollars, and considering that the dollar appreciated significantly compared to most of the other currencies in the world, this also played a role in the decline in overall market capitalization.
World market capitalization index (2010 – present, USDm)
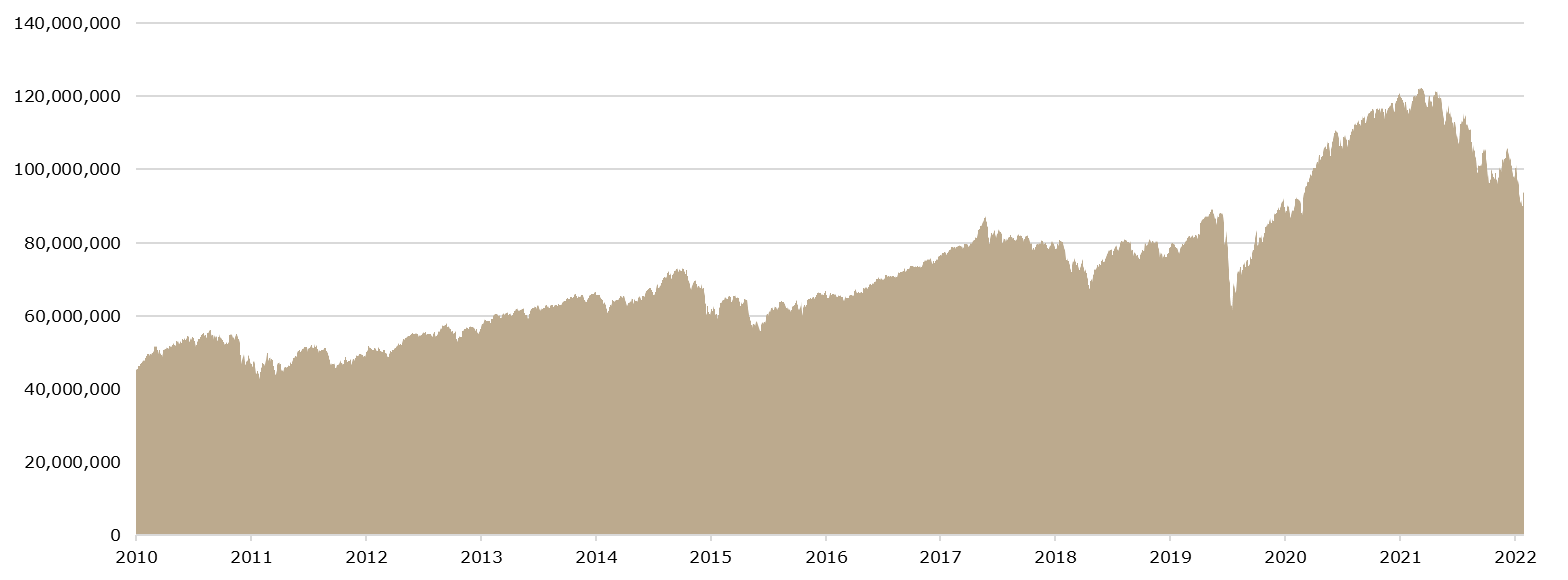
Source: Bloomberg, InterCapital Research
As we can see in the index, the high point in the world market capitalization was achieved on 17 November 2021, when it amounted to USD 122.51tn. Since that point, the market capitalization on the world stock exchanges declined by 24%, or USD 29.05tn. Looking at the data from the beginning of the year, the market capitalization declined by 23%, or USD 28.06tn. This would mean that currently, the overall combined market capitalization of the world stock exchanges amounts to USD 93.45tn.
What this data clearly shows us is that the last three quarters have been one of stagnation and decline in terms of indices, and by extension, company valuations across Europe and the US. Considering that all the underlying factors that influenced these are still present, and the possibility of the entire situation escalating further, the negative sentiment is expected to continue.