The technology sector has been one that has garnered a lot of interest not only around the world but also in the region. Today, we’re bringing you an overview of the company with the largest market cap in the technology sector, listed on the Bucharest Stock Exchange. We would also like to invite you to participate in the Company’s investor day, which will be held in person, as well as virtually on 19 October 2023 and can be accessed here.
The tech sector has boomed significantly for the last couple of decades, with tech giants, especially the American ones dominating investor interest. In fact, despite the challenging macroeconomic situation, in the last couple of months, the growth in the S&P500 index has primarily been driven by the tech sector, and more specifically, companies such as NVIDIA. Croatia also is becoming more and more tech-orientated, with some renowned (yet still private) companies such as Infobip and Rimac Automobili. Of course, publicly listed company Span has also attracted a lot of attention, recording 39% growth YTD.
Today, we decided to take a little bit of a wider look at the region, more specifically Romania, and its largest listed tech company, AROBS. AROBS is a Romanian (and international) software company which was founded in 1998. Over the years, the company expanded, both organically and through M&As, now offering services and products to industries from travel, and medical, to more grounded office and retail solutions.
Last month, the Company started trading on the Regulated Market of the Bucharest Stock Exchange, attracting even more attention. Its current market cap stands at app. EUR 172.7m, making it the largest technology company listed on the exchange. Ever since its IPO back in 2021, the Company recorded significant growth across its operational lines.
AROBS annual revenue development (RONm), YoY growth rate* (%) (2020 – 2023**)
Source: AROBS, InterCapital Research
*2020 growth rate is 0 due to the earliest available data being 2021
**2023 data based on the Company’s outlook
AROBS H1 revenue development (RONm)
Source: AROBS, InterCapital Research
In 2022 and 2023, through M&As, the number of subsidiaries has increased to 26. This allowed for entry into new segments and the offering of new solutions, which was recorded in the revenue growth. In H1 2023, its total revenue increased by 90% YoY, and 8% compared to the 2023 budget. This came as a result of both organic growth, but also the contributions of 7 newly acquired companies after H1 2022.
Annual revenue breakdown by segment (2020 – 2022, RONm)
Source: AROBS, InterCapital Research
H1 revenue breakdown by segment (H1 2022* – H1 2023, RONm)
Source: AROBS, InterCapital Research
*Earliest available data
Breaking this down further, the largest segment, Software services recorded an 83% YoY growth, to RON 177.7m. Software products meanwhile, recorded a 21% YoY increase due to new customers, and these 2 segments combined accounted for 88% of the total turnover. Finally, Integrated systems, the newest business line, which was introduced as a result of the acquisition and integration of AROBS Systems, contributed the remaining 12% of the revenue, at RON 29.1m.
In terms of EBITDA, it amounted to RON 34.6m, decreasing by 6% YoY, also implying an EBITDA margin of 14.4%. However, it should be noted that the EBITDA includes the effect of the Stock Option Plan (SOP) programs, according to which stock options are granted free of charge to employees who meet seniority and performance criteria. Excl. this effect, the normalized EBITDA amounted to RON 43.3m, a 9% increase YoY. Moving on, the net income of the Company amounted to RON 16.4m, a 43% reduction YoY, implying a 7% net income margin. However, if we were to exclude the impact of the SOP, the normalized net income amounted to RON 32.5m, a 1% YoY growth, with a margin of 13%. Lastly, the Company does not currently pay out any dividends.
AROBS annual EBITDA and net income (RONm), and EBITDA and net income margins (%) (2020 – 2023*)
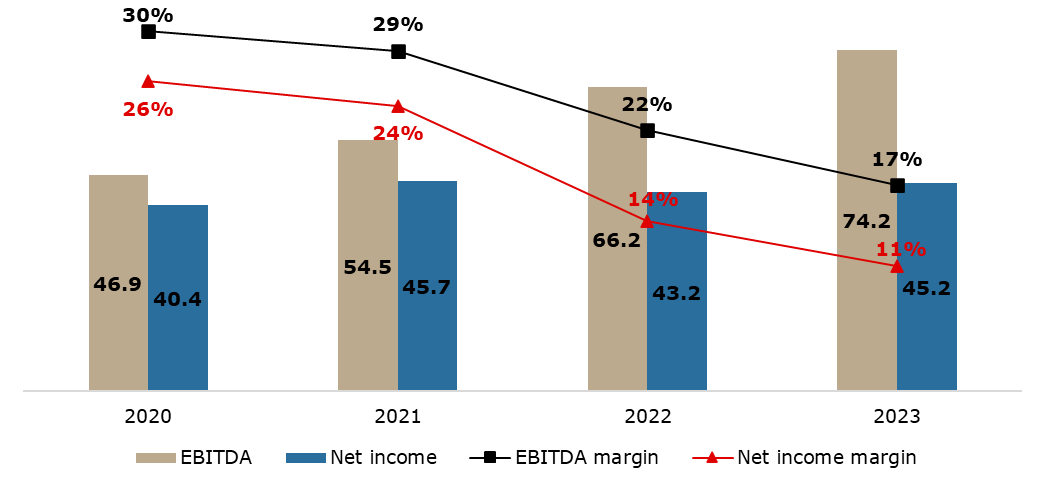
Source: AROBS, InterCapital Research
*2023 data based on the Company’s outlook
AROBS H1 EBITDA and net income (RONm), and EBITDA and net income margins (%) (H1 2021 – H1 2023)
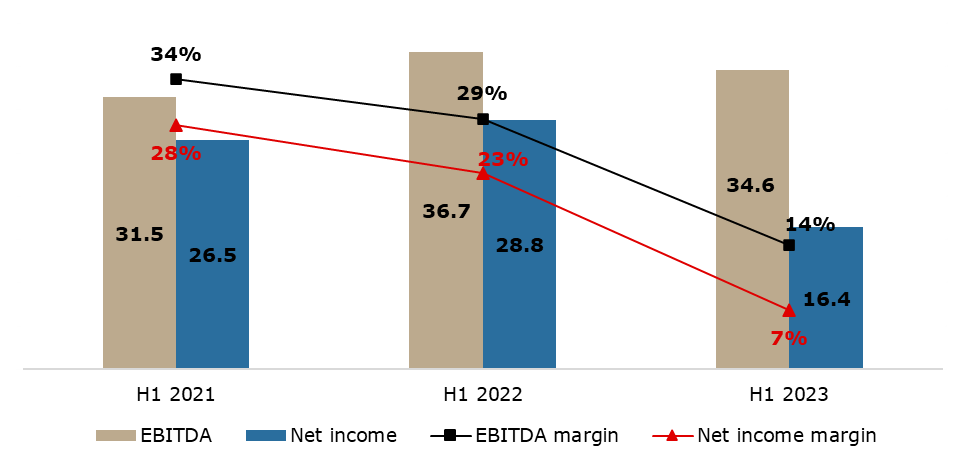
Source: AROBS, InterCapital Research
Besides looking at the financials, it is also prudent to look at the peer group. This, however, should be taken with the caveat that even if companies operate under the same “tech” umbrella, they usually do business with different industries, and as such can be vastly different.
AROBS peer group comparison (Current P/E and P/B)
Source: Bloomberg, InterCapital Research
The peer group is based on comparable companies to AROBS, as well as Span for a regional comparison. The Company’s current P/E stands at 19.9x, while its P/B stands at 4.04x. Compared to its peers, its numbers are higher on a median basis, but lower on the average basis. Given that median numbers are usually the ones used for comparison, we’ll use them here too. As such, the Company is trading at a slight premium compared to the peer group.
AROBS, BET price change since AROBS IPO (December 2021 – 2023 YTD, %)
Source: Bloomberg, InterCapital Research
Since AROBS’s IPO in December 2021, the share price recorded a 46% increase. In 2023 YTD, it grew by 22%. As a point of regional comparison, Span recorded a 77% return since IPO (September 2021), and a 39% return in 2023 YTD. Does that mean that the Company is overvalued? Possibly. However, one has to take into account that the tech sector is composed of growth companies, where future earning expectations also play a role besides the fundamental value. As such, for the tech sector especially, all comparisons should be taken with a large “grain of salt”.
If you would like to participate in the AROBS investor day, which will be held on 19 October 2023, you can register here.