US CPI went above the consensus estimate, but used cars are not to blame this time. It’s the rents and that is not OK if you are in “inflation is temporary” camp. Have you wondered why did the longer end of the curve flatten after the CPI print? We have an explanation. And no, it was no short squeeze. Read it in this brief research piece.
Yesterday’s US CPI print was clearly a tailwind to everyone believing inflation pressures aren’t going away so soon. Although core CPI came right on the consensus estimates (+0.2% MoM, +4.0% YoY), the headline print managed to slightly beat the expectations (0.4% MoM vs. 0.3% MoM expected by consensus). Reasons for concern are hidden beneath the surface of aggregate print: namely, until September rise in CPI was driven by components dubbed as “temporary” or “reopening related”, while used cars were a poster child. This time around things have changed: used car prices dropped by -0.7% YoY, the second consecutive decline after a rapid, double digit increase at the start of the year. But what’s really raising the eyebrows is the fixed income market reaction: the longer end, such as US 10Y, actually got flatter by a couple of basis points. This fueled speculations that the fixed income market oversold the 10Y into the inflation print and wasn’t able to cover after the announcement, thus effectively creating a minor short squeeze.
We decided to subscribe to a different point of view instead: bear in mind that EDZ2 Comdty (Eurodollar futures expiring in December 2022) dropped for a second to 99.33, implying USD Libor at 0.67% at the end of next year versus ATM 0.12% USD Libor. There’s your explanation for why the curve flattened: market is now starting to price in (again) the possibility of FED being behind the curve on inflation, meaning that if CPI really does get out of hand, they will have to hike more rapidly to stop it from spreading. This would imply at least two rate hikes next year (ATM Libor @ 0.12% + 2*25bps = 0.67%) and rate hikes tend to slow down the economy, the reason why longer end of the curve was being bought by the market. And that’s basically the whole story of yesterday’s US yield curve flattening: shorter end was sold, longer end bought and the results you can see right here – the 2Y10Y spread tightened as a result.
If the focus of your interest was exclusively on US CPI, you might have missed the boring FED minutes which were also published yesterday. “Most” of the participants acknowledged the risks open market operations have on OERs and rents, which is a fundamental support for tapering of the asset purchases in November (or December being the latest). The divide still persists on what’s going on with the labor market: doves claim the gap to full employment is quite considerable, while the hawks think supply side disruptions are causing manufacturing to cut shifts since there aren’t enough inputs to utilize more capacity (i.e. labor force). This time you have to give it to the hawks: even here in Eastern Europe anecdotal evidence points in a way of supply side bottlenecks putting a lid on employment. Just yesterday Slovenian car manufacturer Revoz announced they will reduce its staff by 14.5% by the end of the year because of… Well you guessed it. Chip shortage. They’re the most prominent Slovenian company cutting shifts, but clearly not the only one.
But back to FED – the narrative about labor market is clearly in the eye of beholder and it’s still questionable what the FED is going to do to fight the monster of stagflation – i.e. the unfavourable junction of supply side bottlenecks feeding into higher prices and lower employment. Lifting interest rates faster might not be the panacea FED is after, but then again – time would tell.
Source: Bloomberg
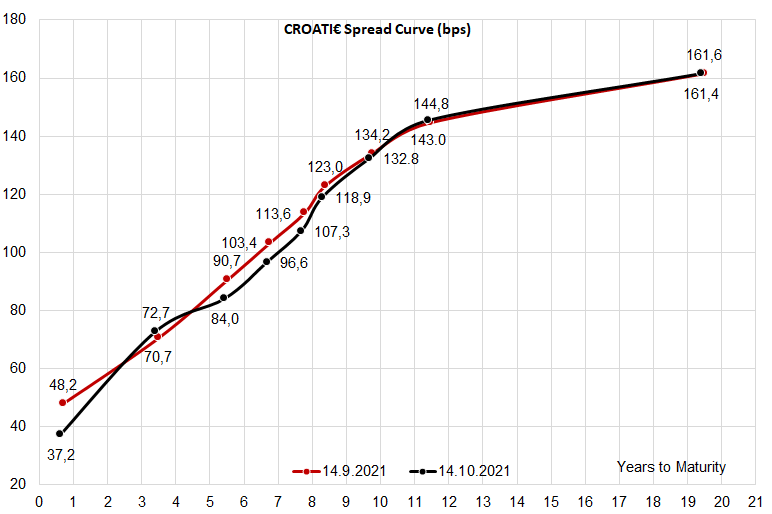
What’s going on with Croatian international bonds? On a five-day horizon the curve gradually steepened, but this week they managed to catch a bid. Market participants are mostly focused on the belly of the curve, paper such as CROATI 3 03/11/2025€ (if they find it at YTM above the freezing level), CROATI 3 03/20/2027€ and CROATI 2.7 06/15/2028€.
Why is that so? From our understanding, some of the UCITS funds have limits up to which they have to be invested into Croatian bonds and some of the buyers fell below these limits, triggering automatic purchases. Fund managers had a difficult job ahead of them – most of them are not sure about the direction if rates, so the most reasonable way to go was to load up on these three bonds. CROATI 3 03/11/2025€ is a “ghost” of a paper – some dealers claim to have seen it being offered, but APA data (BBG MOSB function) comes short of confirming it. Even when some of it appears on the offer, it’s usually short lived since Street dealers who ended up short quickly lift it before somebody else does it for them.
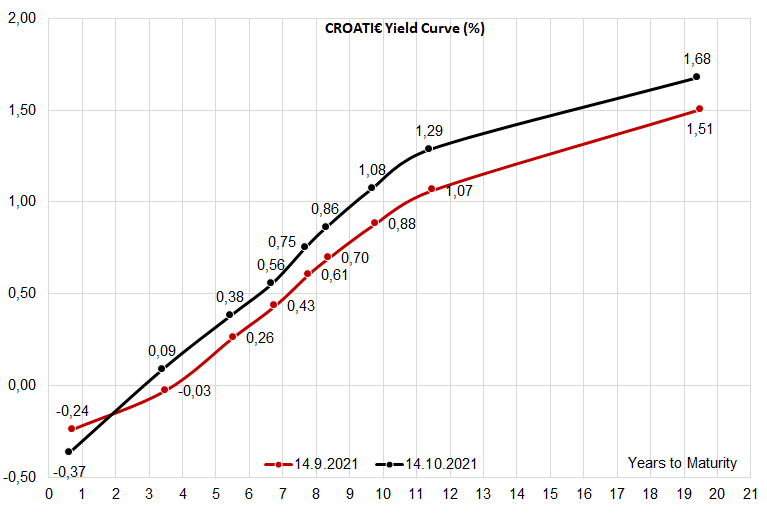
So let’s focus on the next paper on the curve, namely CROATI 3 03/20/2027. UCITS fund managers are veteran traders who understand how fixed income and total return work: bonds tend to roll down the yield curve, so CROATI 3 03/20/2027€ bought today at 0.38% YTM would reasonably expected to be offloaded (if needed) two years from now at some 0.09% YTM (that’s where BBG BVAL placed CROATI 3 03/11/2025€ mid). In other words, you would pay 114.025 today (0.38% YTM, t+2 settlement), sell it at 109.93 two years later, lose about 410 cents on the price, but pocket in 600 cents in coupon, netting some 190 cents in the process. 0.83% in annualized total return on the lowest duration that money can buy on CROATI€ curve. Nevertheless, we stick to the opinion the buying interest might slow down before the fund managers get a hold of direction where the rates might be heading in months to come.