Do you have a feeling that fixed income markets have run into doldrums and there’s a lack of clear direction? You’re probably right because although markets are expecting higher consumer prices in the future, in first quarter the players were betting on rate hikes to accompany higher CPI. A part of these bets have been unwound since there no longer appears to be a market consensus on what the FED might do in one year’s time. What can we expect from today’s NFP and CROATI€ curve – find out in this brief research piece.
The first week of May has been rather dull in terms of heavy economic data or game changing announcement from the central banks. The only possible exception came yesterday from BoE which announced it’s decision to taper asset purchases, but the decision was anticipated by the market and the size of tapering has been smaller than the market have penciled in. However, the week is not over yet and we are waiting to observe the recovery of labour market in the United States with today’s NFP print. So far the pace of recovery has been quite swift and vaccine rollout warrants the payroll figure to keep on rising in April as well. Last figures (covering March data) showed that 916k jobs were added, but the total number of jobs was still some 8.4mm below the level reported in February 2020. Also, some 280k of the total 916k jobs added in March came from hospitality (restaurants and hotels); this category is quite likely to continue performing in April as well, albeit perhaps at a slower pace than in previous month since March data might have been distorted by spring break (a week of vacations for university and high school students). Nevertheless, manufacturing and construction would likely pick up the pace and deliver another 1mm print on the headline figure, sketching full labour market recovery in the coming seven months unless the pace slows down due to some unforeseeable headwinds. This would highlight the bifurcation between the United States and the rest of the world where recovery is stalling because of slower vaccine rollout.
How are markets reacting to these fundamentals? Well, the best place to look is TII 0.125 01/15/2031 Govt on Bloomberg, which is a 10Y on-the-run TIPS. The paper is currently traded at -0.893% YTM and is just 20bps shy of all time low at -1.10%. In mid-March the paper reached it’s one year high at roughly -0.60% but has since pared yield gains and is currently traded close to the all time low. At the same time, plain vanilla UST10Y is traded at some 1.56% YTM and the difference between the two yields is used to calculate the notorious inflation breakevens (you can see it here). So how exactly do we reconcile flatter TIPS curve and unchanged nominal curve? We suggest looking at either EDZ3 Comdty or EDM4 Comdty – the USD LIBOR futures maturing in December 2023 or March 2024. Looking at their implied yields, both futures tell us that rate hike expectations have diminished somewhat and that markets are not really afraid that FED would be forced to send the cavalry and hike aggressively in order to bring down runaway inflation. Reasons might be multiple: yes, US is doing fine in erradicating the Covid-19, but the rest of the world is struggling to keep up (whoever doubts that should look at epidemic crisis in India). US makes up some 20%-25% of global GDP and the airplane of global GDP cannot lift off if only one out of four engines is working. It’s too early for aggressive rate hikes – FED officials have been parroting that and now markets are gradually digesting the big picture and fading out their rate hike expectations. This is why 10Y breakeven inflation rate has been expanding: the short term rate gravitation works only on the TIPS (the nominal rates are not protected from inflation rise and are hence stagnating because lower rate hike expectations are offset by rising CPI).
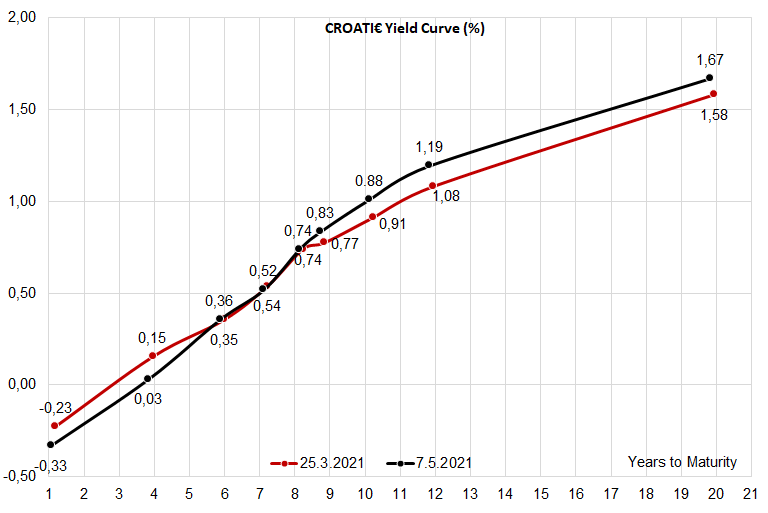
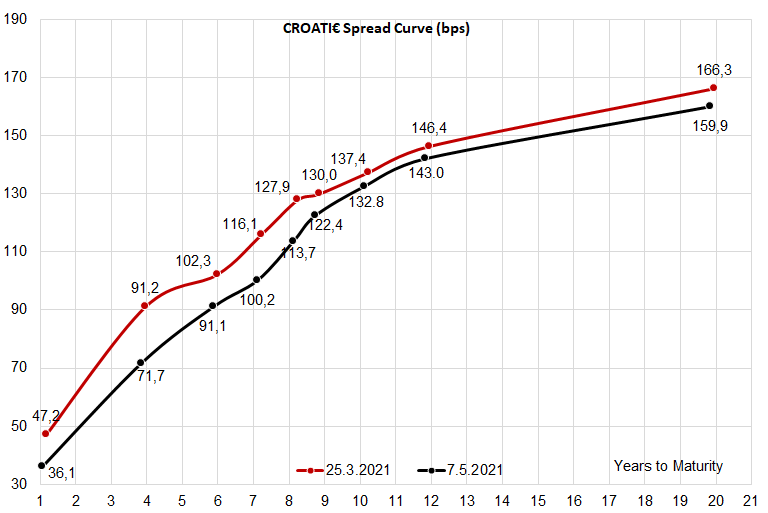
What’s going on in euroland? Well, the benchmark yield curve has obviously moved up, however the CROATI€ spreads have tightened across the curve for several reasons. In last four weeks lo spread (10Y BTP-Bund spread) has been widening and we often look at it as a leading indicator for what the CROATI€ curve might be doing next. Nevertheless, last four days lo spread has ben widening, while Croatian spreads have moved in the opposite direction and tightened a bit. Consistent with our expectations the strongest tightening came from CROATI 3 03/11/2025 which was sought after by several European banks (ALM buying). However, now that the YTM is 0.0%, some of the buyers are getting cold feet and think twice before jumping in on the paper that’s on the verge of negative yield. The smallest spread contraction came from CROATI 1.125 03/04/2033, the reason being that some of the local “fast money accounts” that purchased the paper on the primary market haven’t cut their exposure soon enough and currently the market price is only 40 cents above reoffer. It’s our expectation that these accounts would wait for the pension funds to start adding on duration and then try to sell at whatever price might be (as long as it’s above the reoffer).