Back in 1958 animation wizards William Hanna and Joseph Barbera created a cartoon character called Yogi bear, famous for his statement: “… because I’m smarter than the average bear“. This year about at the same time summer turned into autumn, global bond markets have turned from bullish into bearish and it would be quite useful to know how to manage a bond portfolio in an environment like this. What would Yogi bear do if he was a bond investor? Find out in this article.
Germany avoided a technical recession by a hair’s breadth in 3rd quarter 2019 (this morning figures were +0.1% SA QoQ and +1.0% NSA YoY, versus gloomy expectations of -0.1% QoQ and 0.8% YoY), but still the growth numbers are really anemic and only the removal of Brexit impasse and US car tariffs could more significantly affect the output of the largest European economy.
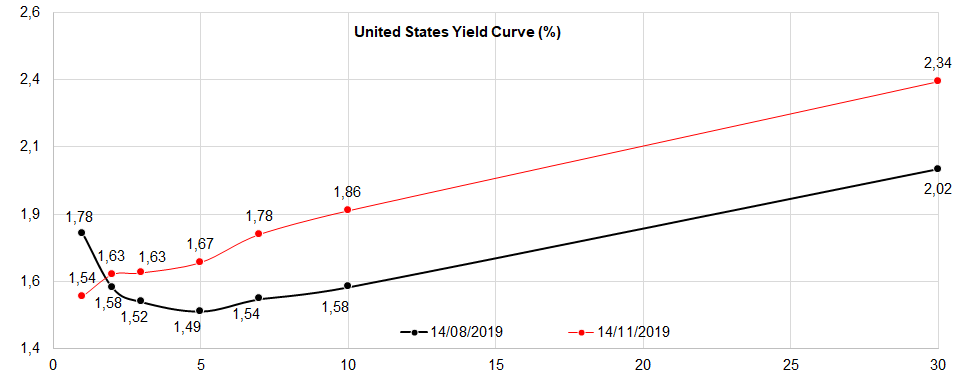
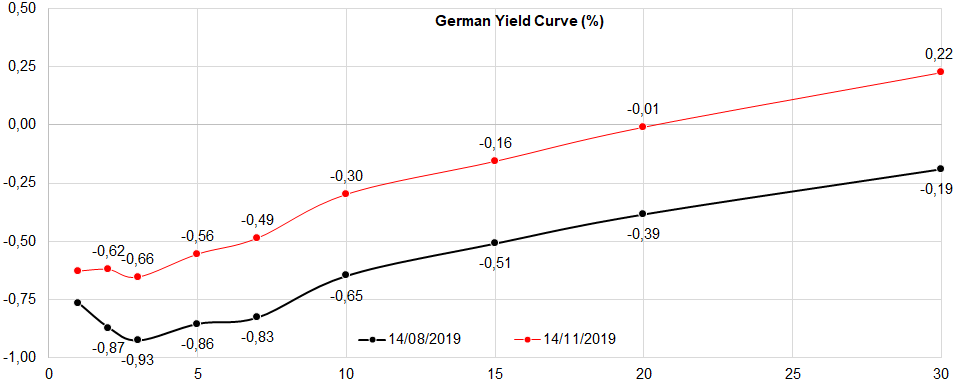
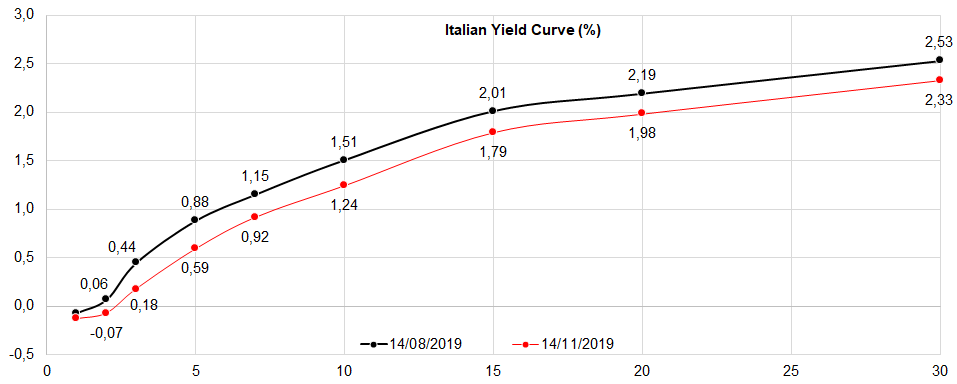
Looking at the global political stage, S&P 500 has completely recovered from August tariff-induced dip and managed to reach new all-time high around 3.100 points. Global equity indices followed in a lockstep, EURUSD plunged while the notorious positive correlation between stock market indices and bond yields resurfaced in a broad bond sell off. The three yield curves (US, German and Italian) submitted below depict two important things to consider: first and most obvious thing is that long term yields moved north by about 30bps (depending upon the maturity of the paper); and second, parts of the yield curve that were inverted in mid-August (namely on US and German yield curves) are inverted no more. The front part of the curve is strongly affected by monetary policy decisions, meaning that short-term bonds are no longer pricing the prospects of cutting interest rates in order to spur economic growth. But more importantly, long-term yields moved up in the anticipation of stronger GDP growth and inflation ahead, which still need to materialise. All three yield curves are certain about one thing: markets are no longer afraid of a Bogeyman called global recession.
Could there be another leg to the bond sell off? On November 08th Messrs. Marko Kolanovic and Bram Kaplan from JP Morgan popped the question about whether rising bond yields could derail the great rotation from defensives/momentum into value/cyclicals. The rotation began in early September (JPM was calling it as early as July) and the first leg was limited to levered speculators’ short covering. You can easily see the rotation by comparing SVX Index (value stocks) to SGX Index (growth stocks) on Bloomberg by using HS function. Kolanovic & Kaplan point out that the second leg of this rotation would be unwound once the phase one deal is actually signed because by then the real money investors would jump in. This rotation would be consistent with rising bond yields, as JPM analysts point out that there might be significant groupthink and crowding out by CTAs in early and mid-summer; there’s a fair probability of this this groupthink being unwound, especially if the good economic data continue coming out.
It’s also worth mentioning that Goldman Sachs’ analysts (the most prominent among them being David J. Kostin) published “Flow of Funds Outlook 2020” in late October, stating that share buybacks will continue in 2020, although at a 2% slower pace compared to 2019. This year S&P 500 increased by +23.42% YTD in spite of share buybacks being close to 20% lower than in 2018 (net corporate purchases amounted to 598b USD in 2018, compared to expected values of 480b USD in 2019 and 470b USD in 2020). In the scenario of balanced economic growth (with trade risks dissipating), it’s quite likely that ETF inflows and household direct purchases would support equity prices next year.
So where does that leave us? Two large Wall Street financial institutions expect rising or steady equity prices in the near term and imply that environment would be supportive for rising yields. This means that the current bond selloff might have more room to run, especially if the JPM’s notion about crowded bond investing in the US is true. On the other hand, European pension funds have allocation limits, meaning that when bond prices, their percentage allocations of bonds relative to equities drop as well, leading them into bond buying to preserve the predefined ratios. Nevertheless, this effect might slow down the sell off, but it will probably not eliminate it altogether.
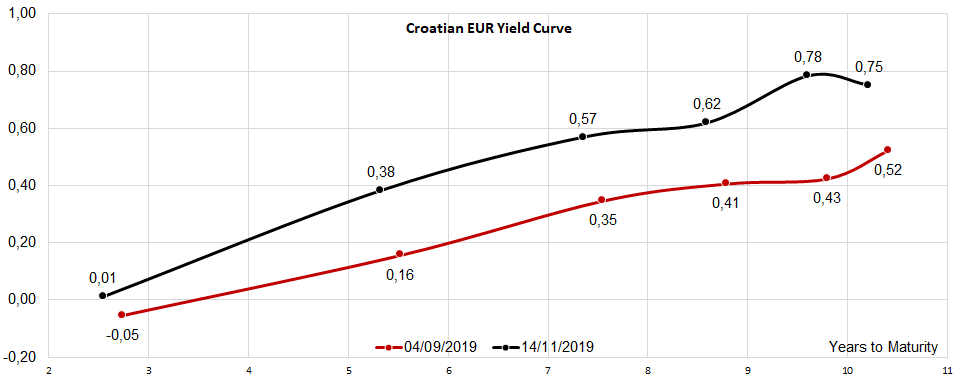
Speaking about Croatian EUR-denominated bonds, the chart submitted below demonstrate that since early September the Croatian curve gradually bear steepened. In our view, the change of the shape of the curve (i.e. more intense move on the longer part of the curve) was exacerbated by late profit taking on CROATI 1.125 06/19/2029, which is currently traded below 103.00. This would explain the belly on the second spot from the right on the black curve, and please note that the chart was composed using average prices (0.78% yield on CROATI 1.125 06/19/2029 implies a 103.17 price; market yield is close to 0.80%).
How do You hedge against this move if it becomes more severe into year end – or in other words, how do You invest smarter than the average bear? A typical hedge against bear steepening is moving on the front part of the curve, so it’s quite likely that Croatian investors might start selling the longer part and move into CROATI 3 03/11/2025, for instance. Buying put options on German Bunds appears to be too costly, especially after a rise in implied volatility following the recent move down in Bund prices. Croatian HRK bonds might be in trouble at this point in time: a typical investor with HRK-denominated balance sheet would be better off if he/she would be prepared to swap his local currency into euros for 6 or 8 months (and get at least 50 points in the forward leg, 0.14% annualized) and hence create a synthetic 2029 HRK exposure yielding 0.94% (0.80% from buying CROATI 1.125 06/19/2029 and additional 0.14% from FX hedging). The liquidity on the local bond market prevents selling local bonds in order to enter this trade on a larger scale, but still it will probably prevent investors from buying local 2029 paper at about 117.00 (0.56% YTM).