Well, at first sight the paper does offer a couple of basis points in higher yield compared to CROATIA 2030 EUR, but a more thorough look at the modified duration might give You second thoughts. On the other hand, Croatian USD curve gets interesting only at the mid part (CROATIA 2021 USD) from the spread perspective.
Yesterday marked two full weeks of trading in brand new Croatian international bond – CROATIA 2029 EUR – and, oh boy, have we seen some price appreciation in rather a brief time frame. First of all, the paper was placed @ 1.324% YTM (MS+105bps/Bund+155.9bps) and looking at yesterday’s screen, you could easily see that the financial markets couldn’t get enough of it. Two weeks ago when the orderbook was open, the IPT stood @ MS+135bps (YTM @ 1.62%). As the orders were piling in, the IPTs were eventually cut all the way down to MS+105bps (YTM @ 1.324%); two weeks and two major dovish central banks later, the I-spread has been reduced to merely 89.3bps. Looking at the yield curve submitted below, CROATIA 2029 EUR is the second dot from the right on the black curve, and it’s traded @ 1.10% YTM.
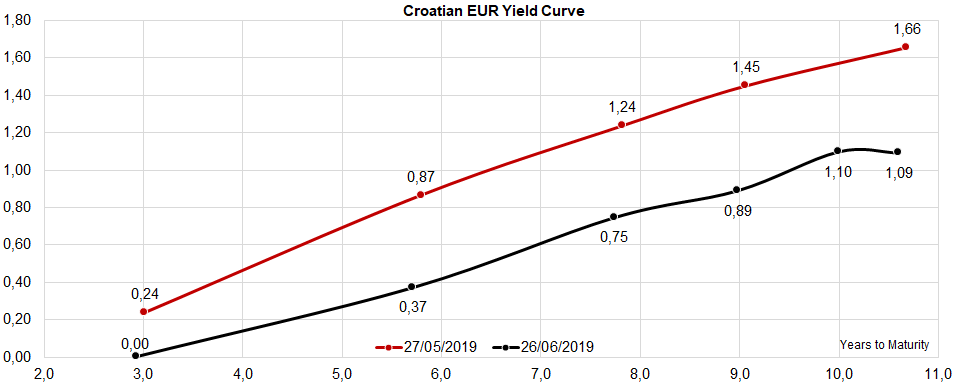
The question remains whether CROATIA 2029 EUR is fairly valued since looking at the yield curve you can easily see that the paper is still traded at a higher yield compared to CROATIA 2030 EUR – is the optics misleading? Well, it might be. First of all, CROATIA 2029 EUR has a slightly higher modified duration compared to CROATIA 2030 EUR. The reason behind this is the fact that modified duration represents nothing more than the cash-weighted time to maturity – since CROATIA 2029 EUR bears an annual coupon of just 1.125%, while CROATIA 2030 EUR carries 2.750% annually, the cash-weighted time to maturity of the first paper is a bit higher than that of the latter. In other words, with smaller regular coupons payments it takes longer to get your money back and you would want a higher discount to make the risk worthwhile. At current prices, the 29s have a modified duration of 9.39 years, while the 30s have a modified duration of 9.25 years. You can try this for Yourself using either Excel or Bloomberg – the latter with YAS function. Since higher modified duration spells higher volatility, this might explain why the investors prefer the 30s to 29s and hence the slight backwardation on the long end. Don’t worry, the curve is not broken – as a matter of fact it’s working exactly as it should be.
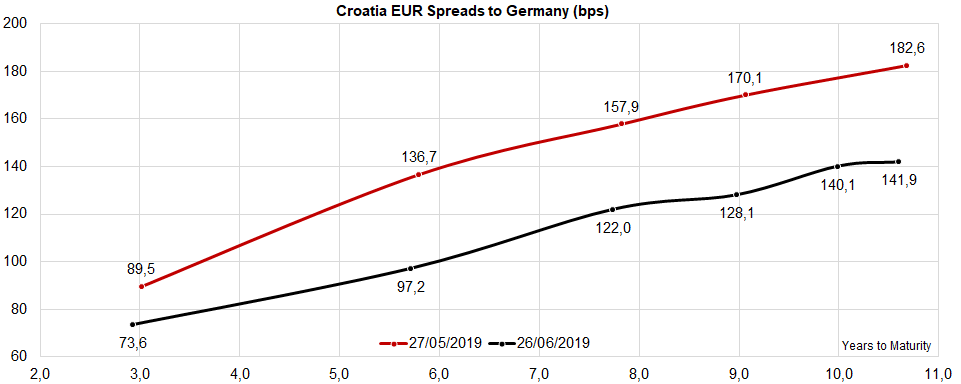
The differences in duration and yield are rather small, but if you thought that CROATIA 2029 EUR is mispriced because you can buy it in the Street at a higher yield to maturity compared to CROATIA 2030 – well think again. Also, the current spread curve (using German paper of the equivalent maturity as a benchmark) point out that 30s are traded at a slightly higher risk premium compared to the 29s. The spread curve also indicates that CROATIA 2027 EUR (122bps of risk premium versus Germany, the third dot from the left on the black curve) looks rather interesting since after this particular maturity the spread curve gets quite flat and doesn’t compensate the bearer of the paper with adequate premium for additional risk.
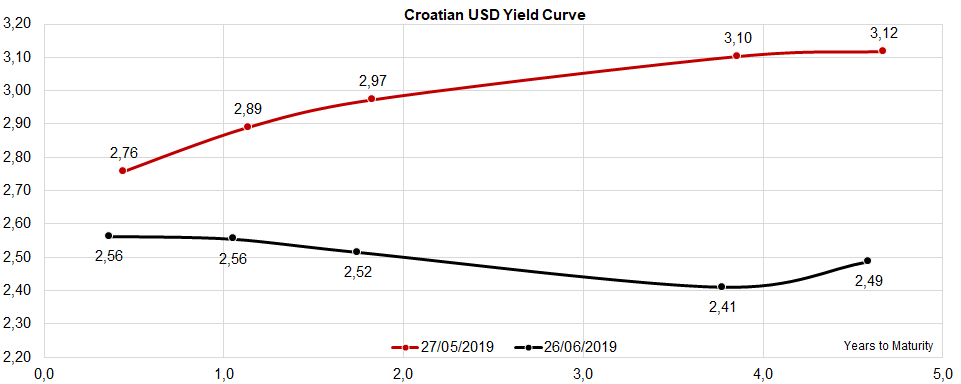
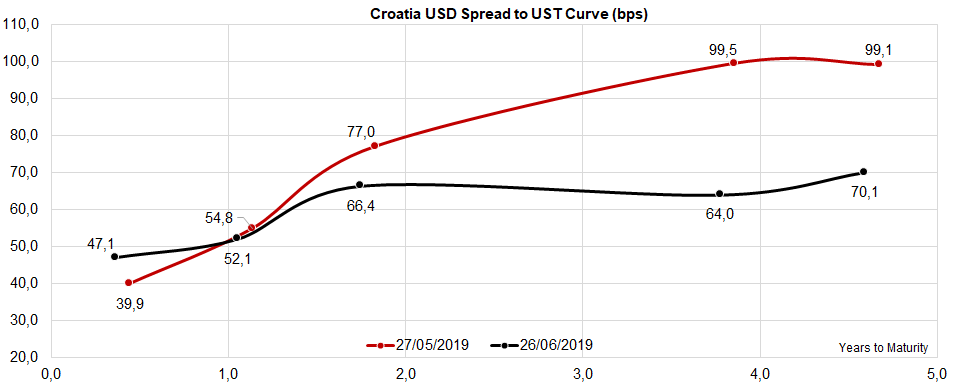
Looking at the dollar denominated international bonds, it’s obvious that the yield curve got flat on the front end and inverted on the longer segment. By taking a glance at the USD spread curve, CROATIA 2021 USD looks most attractive since it offers 66.4bps over USTs, which in these circumstances looks rather rich. Curious, isn’t it? But take one more look at the USD curves and you will get a good feeling of how the market is ticking – the front part of the yield curve (the first three dots from the left on the black curve) is rather flat, but since the UST curve is inverted, the spread curve gets steep on the front end.
What happens next? Well, first of all take a look at FFQ9 Comdty on Bloomberg (August FED fund futures, the contract expiring after FOMC), or simply click here. The contract implies merely one rate hike on July meeting (100 – 97.935 = 2.065% implied, the current band is @ 2.25%-2.50%) and this is mostly thanks to James Bullard giving financial markets a proper smack in the face by ending the wet dream of a 50bps rate cut on the upcoming meeting. We might be in a slowdown, but we’re not in a recession yet. Could this mean that the fixed income might be ready for a slight correction? It depends upon the actions of other global central banks, so watch for reactions from ECB and BOJ.