This week we have seen 10Y EUR benchmark breaching level of -15bps. Lowest intra-day level ever recorded was back in July 2016 (-20bps) when Mr. Draghi was heavily driving his asset purchase program of EUR 80bn a month while inflation was below zero. Today, situation is quite different; however, bids on Bund persist. In this short article we are looking at macroeconomic indicators and monetary policies in euro zone now and then.
At his speech in London 7 years ago, Mr. Mario Draghi said that ECB is ready to do whatever it takes to preserve the euro as debt crisis in peripheral countries almost tore apart monetary union. Week after the speech, ECB announced Outright Monetary Transactions which calmed investors and pushed yields down across the euro zone, although in practice “Draghi’s put” has never been used.
Two years later, in the end of 2014 inflation in euro zone measured by HICP fell below zero and ECB introduced its asset purchase program that was already well known in Japan and US. Under ECB’s QE, central bank spent EUR 2.6tr on government and corporate debt, asset backed securities and covered bonds in less than 4 years. As a consequence of extremely loose monetary policy both GDP and inflation finally accelerated while bonds yields reached their bottom (or at least we thought that’s their bottom at the time).
After negative rates in the first half of 2016, inflation finally increased and reached targeted 2.0% YoY in the beginning of 2017 but since then moved in range of 1.10% – 2.30% as you can see on the Chart submitted below. Furthermore, in the beginning of July 2016 bund yield fell all the way to -20bps and remained in the negative territory until September of the same year. Yields then increased as inflation picked up and investors expected ECB to start tightening its monetary policy.
In the end of 2017/beginning of 2018 inflation and strong labor market data in US sparked fear that the same could happen in euro area and Bund yield rose all the way to 80bps. Back then, analysts from all over the world were saying that 30-years era of bonds is over as central banks were expected to make a U-turn in their policies.
However, economic growth in euro area decelerated in 2018. ECB’s governor said that net APP will stop by the end of 2018, but rates are to be held at the bottom at least until summer 2019. Furthermore, political crisis in Italy pushed EUR investors to unwind their trades and to buy Bund once again which depressed Bund yield to 20bps in mid-2018. Yield on Bund was above 50bps only few days in the beginning of October 2018 (before big equity sell-off) and since then moves in only one direction – south. Today’s levels are a product of overly dovish FED, but also many risk-off events like Brexit and Italian confrontation with EC regarding EDP but also due to slower growth in euro area that just can’t get out of woods. It would be no surprise in case ECB decides to decrease reference rates even more or to restart its APP in case of further slowdown of the economy.
Looking at the Chart, it is interesting to see Bund levels once again at -15bps, same levels where they stood when inflation was below zero and ECB was the biggest bond buyer. Today, inflation is close to 2.0% and ECB only re-invests its funds. More and more analysts now expect Japanese scenario to occur in euro area. Could you now find a person who thinks bond era is over?
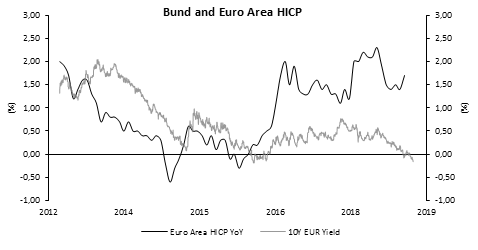
Source: Eurostat, Bloomberg, InterCapital