For this week’s blog, we decided to present you with betas of each constituent of the CROBEX index, along with the issues of estimating them.
Recently we published a blog regarding Croatia’s equity risk premium development, which is one of the crucial components of calculating the cost of equity and, therefore, an important factor in valuing companies. In this week’s blog, we decided to present you with levered betas of CROBEX components, which is another vital component of calculating the cost of equity.
Based on CAPM, determining a risk-free rate and an equity risk premium is enough for estimating the cost of equity for an average risk company. But what if the company is not average risk? This is where beta is introduced as a measure of a relative risk. In a sense, beta represents a measure of volatility of a certain stock compared to the entire market (usually represented by the main index).
Estimating a beta for a company can be done by running a regression of returns on a certain stock against the return on the market index, in which the slope of that regression is the beta. For example, beta of 1 indicates that a certain stock is as volatile as the market. A beta higher than 1, indicates that the stock is more volatile than the market, while a beta less than 1 shows that a stock is less volatile than the market.
In the graph below, you can see betas for each constituent of the CROBEX. As beta represents a measure of volatility compared to the entire market, the strongest and weakest performing stocks should be the ones with the highest deviation of beta from the market value of 1. However, we need to note that due to low liquidity of the Croatian capital market the calculated betas can be over or underestimated and thus we advise to compare the results at least with the peer group.
Levered Beta of Each CROBEX Constituent*
Source: Bloomberg, InterCapital Research
*Based on a 5 year period (since 2015), weekly returns of CROBEX and each stock
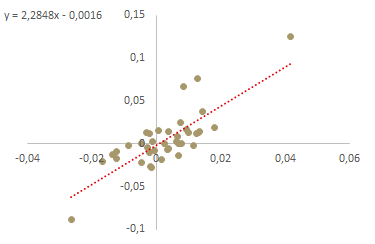
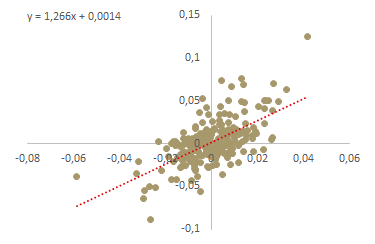
It is important to note that estimating a beta by doing a regression comes with a certain burden, which stems from how the regression is set up. It is possible to get a significantly different beta based on what period the regression was based, what index was used as an independent variable, which returns were used (daily, weekly, monthly) etc. So, for example, when observing the beta of Podravka, with a YTD period, it amounts to 2.28 suggesting that its stock is more than twice as volatile as the market (CROBEX index). However, if were to change the observed period to 5 years (since 2015), the Podravka’s beta amounts to 1.27. On the other hand, on a 10-year period (since 2009), Podravka’s beta using weekly returns amounts to 1.02, while it amounts to 0.74 when using daily returns. This means that by changing the above-mentioned parameters, the same company went from being more than twice as volatile than the market, to being less volatile than the market. It becomes very evident how calculating a beta by just running a regression can be problematic. We again stress that such high variations in our view stream from very low liquidty of the market.
Podravka’s Beta (YTD period)
Podravka’s Beta (2015 – 4.10.2019)
Source: Bloomberg, InterCapital Research
Source: Bloomberg, InterCapital Research
Instead of thinking of betas in a sense of regressions, we should look at the sources of the relative risk of the company such as what business is the company in. As a rule of thumb, the more discretionary a company’s products or services are, the higher beta it should have. For example, we should expect a company like LVMH (a luxury goods group) to have a higher beta, than an average food company, as the customers can delay purchasing such goods.
Further, increase of beta correlates with increase in leverage. Additionally, looking at a company’s cost structure can give us more insight about its beta. As a company increases the proportion of fixed costs, the higher the beta it should have (and the other way around).
Another good example on why running a regression is not the best (or the only) choice when estimating a beta for a company can be observed when looking at NLB Group, which was listed on LJSE in November 2018. By running a regression of returns NLB Group against the return on SBI TOP since their public offering, we would end up with a beta of 0.38. On the other side, by averaging the regression betas of the comparable companies we would get around 1.2. We believe that the estimation of the comparable companies beta tends to give a more accurate estimation, as the standard error should be significantly lower than the one used on a single regression. Although we base all our analysis on fundamental models, one needs to remain aware of the specificity of the underlying market and thus we find prudent to use sector analysis rather than single-outing one specific stock for beta estimate.