
The recent listing of a Polish equity ETF on the Zagreb Stock Exchange offers an occasion to take a closer look at the Polish capital market itself. We have already covered Poland’s macroeconomic fundamentals, growth trajectory, WIG30TR index composition, valuation, and key risks in detail, and you can read that piece here. This text shifts the focus to the capital market side of the story: market depth, liquidity, capitalization, investor structure, and the structural room for further development that the data suggests.
The Warsaw Stock Exchange is, by virtually every relevant metric, the largest and most developed capital market in Central and Eastern Europe. With more than 750 companies listed across its Main Market and SME Growth market, a total market capitalization of WSE-listed companies exceeding EUR 600bn, and average daily turnover in cash equities above EUR 600m, the WSE operates at a scale that no other CEE exchange approaches. The WSE Group itself generated EUR 130m in revenue and EUR 53m in EBITDA in FY 2025. There are 44 stocks on the exchange trading above USD 1m per day, and Polish equities carry a 1.15% weight in the MSCI Emerging Markets index alongside a 0.15% share in the FTSE Developed Markets index. What sets the WSE apart from most regional exchanges is not just size, but the combination of issuer breadth, daily liquidity, foreign investor presence, institutional infrastructure, and product availability. Most CEE markets face a common set of constraints: a limited number of liquid names, lower free float, thinner daily turnover, and a narrower base of institutional capital. Poland is structurally different from its regional peers in this regard, coupled with really interesting valuations, which is precisely why it attracts a qualitatively different type of investor flow.
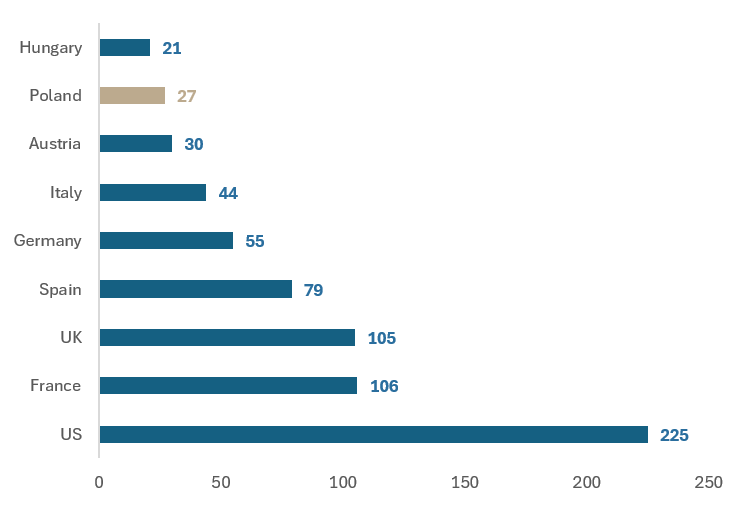
Market capitalization to GDP (2025, %)
Source: Market capitalization: Bloomberg (LHS), FESE (RHS); GDP data: World Bank, WSE presentation InterCapital Research
The so-called Buffett Indicator, which compares the market capitalization of listed companies with the size of the economy, provides useful context here. Poland’s market cap to GDP ratio stood at 27% in 2025, up from 22% in 2024. For comparison, the EU average sits at around 70%, while the US is at approximately 225%, France at 106%, the UK at 105%, Spain at 79%, Germany at 55%, Italy at 44%, and Austria at 30%. Hungary, at 21%, is the only CEE peer in the chart sitting below Poland. As we noted in our earlier analysis of the Buffett Indicator across the region, a low market cap to GDP ratio does not automatically signal that a market is cheap. Rather, it suggests that the capital market has not yet developed proportionally to the size of the underlying economy. In Poland’s case, this is more of a structural signal, pointing to room for capital market deepening over time, rather than a straightforward valuation indicator.
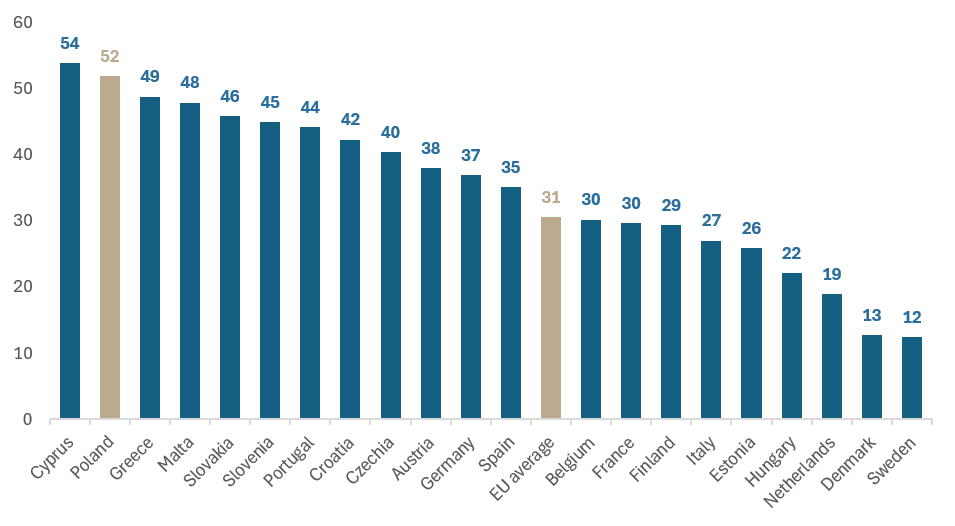
Currency and deposits as % of household financial assets (2024, %)
Source: Eurostat, WSE presentation, InterCapital Research
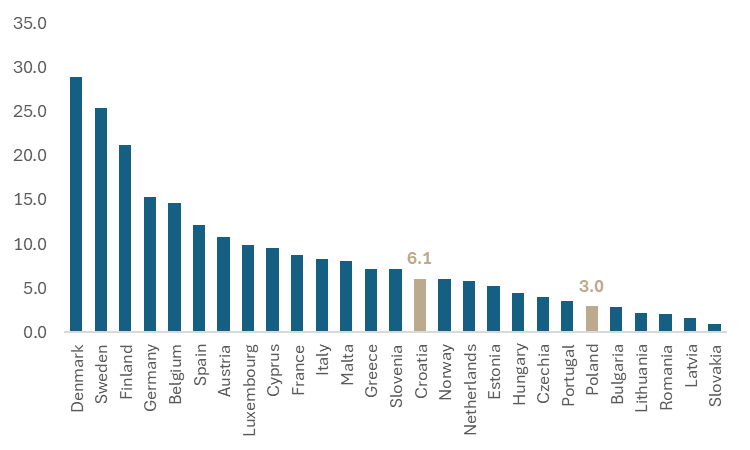
One of the more telling structural data points concerns the composition of household financial assets. In Poland, cash and bank deposits account for 52% of household financial assets, the second highest in the EU behind only Cyprus, compared to an EU average of 31% and just 12% in Sweden. Croatian readers will find this familiar, as the domestic media regularly reminds us how much Croatians keep in bank deposits, but Poland actually has it worse: Croatia sits somewhere in the middle of the EU ranking, while Poland is near the very bottom. On the equity side, the picture reverses somewhat but remains weak. Listed shares represent only 3.2% of Polish household financial assets, placing Poland sixth from the bottom in the EU, behind Bulgaria, Lithuania, Latvia, Portugal and Slovakia. The EU average is 7.8%, Sweden leads at 24.2%, and even Croatia (5%) ranks noticeably higher. The implication is significant. Reducing the cash and deposit share in Polish household assets toward the EU average could theoretically free up around PLN 700bn (approximately EUR 165bn) of additional assets for investment. This is not a forecast; it is a mechanical illustration of the gap. Whether and how quickly this shift materializes depends on several factors: tax policy, trust in capital markets, the quality and accessibility of investment products, and broader financial education. The point is that the Polish capital market story is not only about the current size of the market, but about the potential reallocation of a large domestic savings base that remains heavily concentrated in bank deposits.
Listed shares as % of GDP, Households, (2025, %)
Source: Eurostat, InterCapital Research
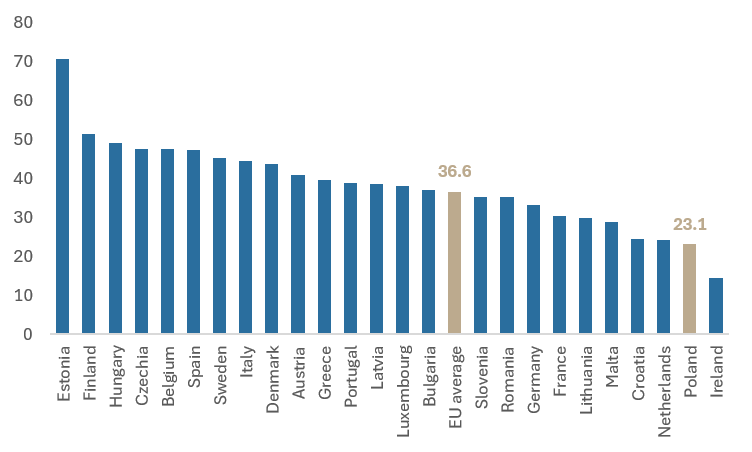
Poland’s domestic institutional capital base remains relatively modest by European standards. Pension fund assets stand at approximately 8.5% of GDP, while mutual fund assets are at around 10.5% of GDP, both well below the levels seen in Western European markets. For context, Croatia’s pension fund assets stand at roughly 30% of GDP, significantly above Poland’s 8.5%, largely thanks to the mandatory second pillar system in place since 2002. This limited institutional depth has historically constrained domestic demand for equities and investment products. One initiative that could change this trajectory is the proposed Personal Investment Account (Osobisty Konto Inwestycyjne, or OKI), which envisages tax exemptions on investments in domestic assets up to PLN 100k (approximately EUR 24k), with a lower tax rate above that threshold. The model is inspired by Sweden’s ISK accounts, where assets under management have reached approximately EUR 180bn with a participation rate of 41%. If implemented effectively, OKI could serve as a catalyst for broader retail participation in the capital market. That said, building a market-oriented savings culture is a process measured in years, not quarters. The Swedish experience itself took over a decade to reach its current scale, and replicating it requires sustained policy commitment, product quality, and investor confidence.
Equity and investment fund shares as % of household financial assets (2024, %)
Source: Eurostat, WSE presentation, InterCapital Research
The ETF segment on the WSE has been experiencing strong momentum. In 2025, ETF trading volumes reached EUR 781m, representing growth of 121.5% YoY. In the first three months of 2026, volumes already reached EUR 460m, up 194.3% YoY. The number of ETF, ETC, and ETN products listed on the WSE has doubled since the beginning of 2025, reaching 28 listed funds as of May 2026, with providers including BlackRock, Vanguard, and PZU, among others. ETFs function as a natural entry-level investment product. They broaden market access, lower the barrier for retail and smaller institutional investors, and naturally increase turnover in underlying instruments. For a market as large and sectorally diversified as Poland, where individual stock selection may be more demanding for a non-specialist investor, an ETF provides a simpler and more efficient way to gain broad exposure. The listing of a Polish equity ETF on the Zagreb Stock Exchange fits precisely within this logic, making a liquid and deep market accessible through familiar local exchange infrastructure.
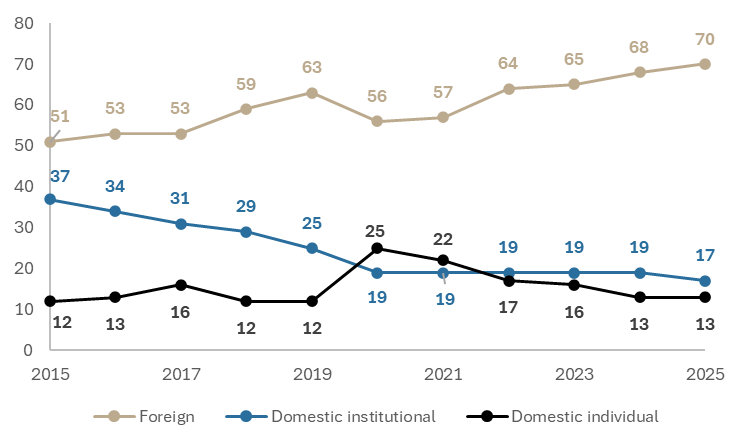
The investor structure on the WSE Main Market underlines the exchange’s international relevance. In 2025, foreign investors accounted for approximately 70% of equity trading, with domestic institutional investors at around 17% and domestic retail investors at about 13%. The exchange has 21 domestic and 17 foreign members from 7 countries, with names like Goldman Sachs (23.1%), PKO BP (10.8%), Bank of America (8.8%), JP Morgan (7.1%), UBS (6.2%), Santander (5.0%), mBank (4.6%), Pekao (4.4%), Morgan Stanley (4.4%), and Citi Handlowy (4.1%) among the most active brokers. The high share of foreign investors confirms two things simultaneously. On the positive side, it reflects the international credibility and infrastructure quality of the WSE, as global investment banks would not maintain active membership and significant flow on a market they did not consider institutionally sound. On the other hand, it also means that the market is more sensitive to shifts in global risk appetite and capital allocation decisions made outside Poland. In a regional context, this level of liquidity is a key advantage: it allows for better price discovery, enables larger position entries and exits, and supports a wider investable universe.
Share of investors in equity trading on WSE Main Market (%)
Source: Eurostat, WSE presentation, InterCapital Research
Poland offers a combination of macroeconomic scale, capital market depth, daily liquidity, and a structurally underdeveloped market cap to GDP ratio that, taken together, positions it as the most relevant equity market in the CEE region. The household savings structure, with more than half of financial assets still sitting in cash and bank deposits, represents a latent source of domestic demand that could support further market development over time, provided the right policy and product conditions are in place. At the same time, risks are real and should not be understated: the market’s heavy reliance on foreign investor flow, the geopolitical context, the evolving tax and regulatory environment, and the concentration of state-owned enterprises in the index all require ongoing monitoring. An ETF-based approach may be a rational way for investors to gain diversified exposure to a market that is larger and more liquid than the regional average, but one that still carries the structural characteristics and risks of a market in transition. Whether Poland can sustain its current trajectory and close the gap to more developed European capital markets remains to be seen. As always, none of this is investment advice, so do your own homework before reaching for the buy button.