In my previous blog post (link), I briefly introduced how the VIX index is calculated and discussed some of the difficulties we face when trading it. We concluded that although VIX has a strong negative correlation with the S&P 500, trading it directly is challenging. Holding VIX futures, or gaining exposure indirectly via ETFs, whether long or short, tends to be punishing over the long term.
Today, we will go one step further and examine what actually drives changes in the VIX index, by how much it moves, and what those moves really mean for your option positions.
If we set aside changes in interest rates and structural effects related to time to maturity (for example, when 22-DTE options roll out and are replaced with 35-DTE options), the primary drivers of changes in VIX are changes in option prices. More precisely, changes in their implied volatilities. However, not all volatility moves are created equal. To truly understand what drives VIX, we need to think in terms of movements of the entire volatility surface, not just “vol up” or “vol down.”
VIX Index
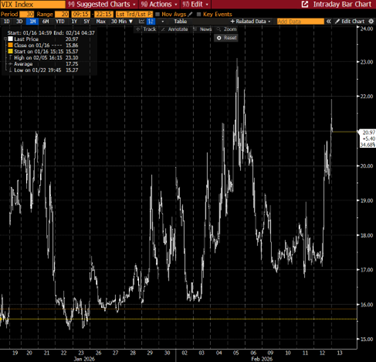
Source: Bloomberg, InterCapital
Broadly speaking, there are two conceptually different ways the surface can move.
The first is a parallel shift. Imagine the entire implied volatility surface lifting higher by roughly the same amount across strikes. In that case, at-the-money (ATM) volatility rises, out-of-the-money volatility rises, and the overall level of implied variance increases more or less uniformly. Because the VIX methodology aggregates a strip of out-of-the-money options across strikes, with the most significant weight around the forward (near-ATM region), a parallel move transmits directly into the index. In such situations, ATM volatility largely drives the calculation, and VIX behaves as a relatively clean proxy for “the change in level of volatility.”
The second type of move is a skew shift, a change in the shape of the volatility surface rather than its overall level. Here, deep out-of-the-money puts (or calls) can become significantly more expensive while ATM volatility barely moves. In this scenario, the left tail of the distribution steepens (or, in other environments, flattens). Because the VIX formula weights options by 1/K2, lower strikes mechanically receive relatively larger weights. This means strong demand for downside protection can influence the index disproportionately. In skew-driven markets, the tails dominate the story.
This distinction is crucial for traders. A rise in VIX does not necessarily imply a uniform increase in implied volatility across your option book. If the move is parallel, your ATM options will feel it directly. If the move is primarily skew-driven, your exposure depends heavily on where you sit on the surface.
There is also a more technical effect that often appears during high-volatility events: widening bid-ask spreads in deep OTM options. Because VIX uses the midpoint of quoted bids and asks, not actual transaction prices, a sharp widening in spreads can artificially inflate the index. In extreme cases, this can push VIX significantly higher even if the “true” tradable volatility has not moved by the same magnitude.
So what does a spike in VIX actually mean for your option position?
An option’s price is determined by several factors before expiry. The well-known Greeks describe the sensitivity of the option price to movements in the underlying, changes in implied volatility, and the passage of time. Buying a put can be an effective way to express a bearish view on the S&P 500, partly because of the typical inverse relationship between the index and implied volatility.
The problem is that the move in implied volatility embedded in your option is often much smaller than the move suggested by VIX. For example, suppose VIX jumps by 3.5 points (figure below), but the ATM option you purchased gains only 0.5 volatility points. Looking at the surface, you might find that most of the repricing occurred in the tails. In that case, while you may benefit from delta gains if the market falls, the volatility component of your position does not reflect the magnitude implied by the VIX headline. There may have been more efficient structures to express that view.
S&P 500 futures options volatility surface before and after the spike in volatility
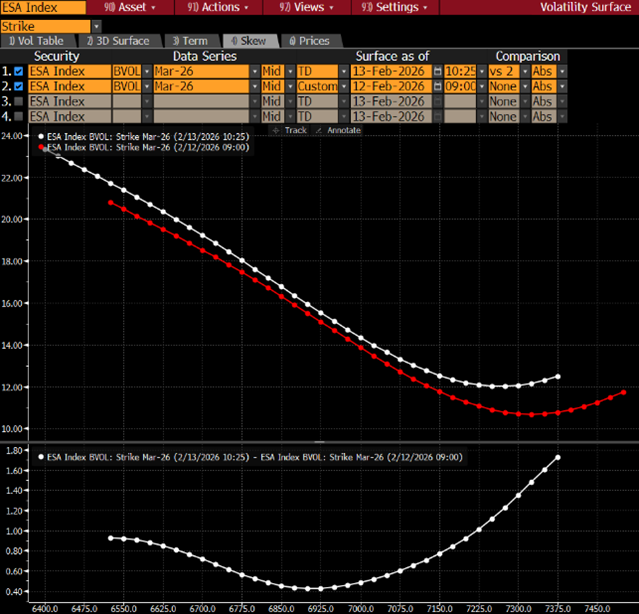
Source: Bloomberg, InterCapital
VIX term structure before and after the spike in volatility
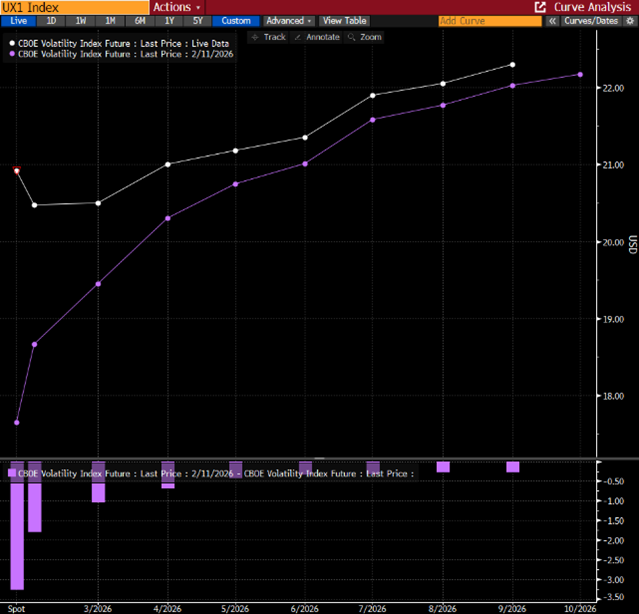
Source: Bloomberg, InterCapital
This leads to the key takeaway: As we already said before, VIX is not a tradable asset. It is a weighted statistic. Its movements can originate from different parts of the volatility surface. Whether the driver is a parallel shift or a skew repricing determines how your positions respond. Understanding which part of the surface is moving matters far more than reacting to the VIX index level itself.
In other words, before trading volatility, ask yourself not “Is VIX going up?” but rather, “What move will happen on the volatility surface?”