Today, we analyze the H1 YoY performance across five benchmarks, CROBEX, SBITOP, S&P 500, Nasdaq 100, and EURO STOXX 50, covering the period from 2004 to 2025. The goal is to place our regional markets in a wider global context and show how their first halves compare with the largest US and European indices. This perspective allows us to see not only where Croatia and Slovenia stand today, but also how their development over time measures up against deeper and more liquid markets abroad.
Of course, some common patterns emerge across all indices. Certain years clearly stand out as crisis years, 2008, 2009, 2012, and, more recently, 2022, when every market found itself in the left tail of performance. These shared stress points confirm that the deepest setbacks were global rather than local.
CROBEX, SBITOP, SPX, NDX, SX5E H1 YoY change, (2004-2025, %)
Source: Bloomberg, InterCapital Research
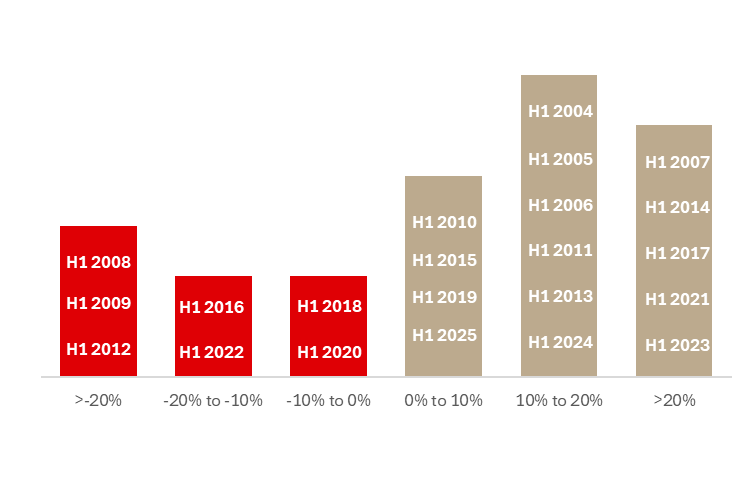
Turning our attention to CROBEX, the recent trend is encouraging. In the last few years, especially 2024 and 2025, the index delivered strong right-tail performance. This momentum is closely correlated with Croatia’s solid GDP growth, higher wages, increasing retail participation, stronger involvement from institutional investors, deeper liquidity, and a livelier primary market. IPOs such as ING-GRAD and Žito already took place, while Tokić is preparing to enter the market. All these elements explain why the market has shown such strong results in recent years and why sentiment on the domestic exchange improved significantly. CROBEX’s recent strength is not only macro-driven but also supported by companies with fundamentally solid positions, whose improved balance sheets and earnings have reinforced the index’s performance.
CROBEX H1 YoY change (2004 – 2025, %)
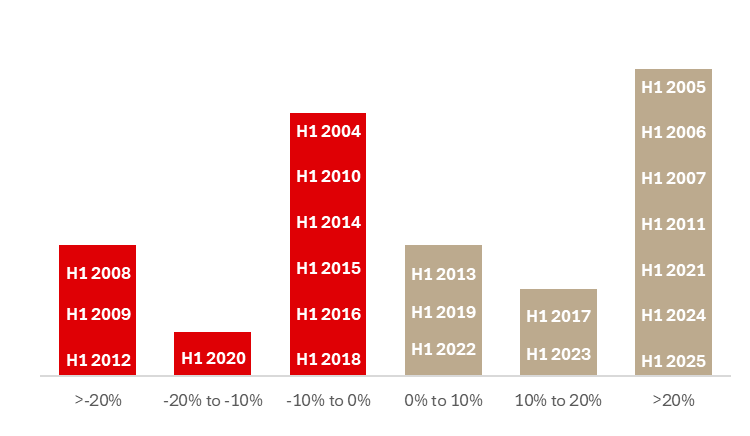
Source: Bloomberg, InterCapital Research
SBITOP shows a somewhat different but equally impressive story. Recent H1 gains have been large by global standards, but unlike Croatia, this is not primarily a GDP correlation story. Slovenian companies from SBITOP are fundamentally strong, with robust business models, stable cash flows, and significant export exposure. They sell across developed and regional European markets, benefiting directly from global demand, and the steady rise in Slovenia’s GDP has also provided additional support. Because these companies are competitive abroad and export everywhere, investors recognize their quality, and the market prices them accordingly. This makes SBITOP’s strong performance credible and sustainable, with fundamentals as the key driver.
SBITOP H1 YoY change (2004 – 2025, %)
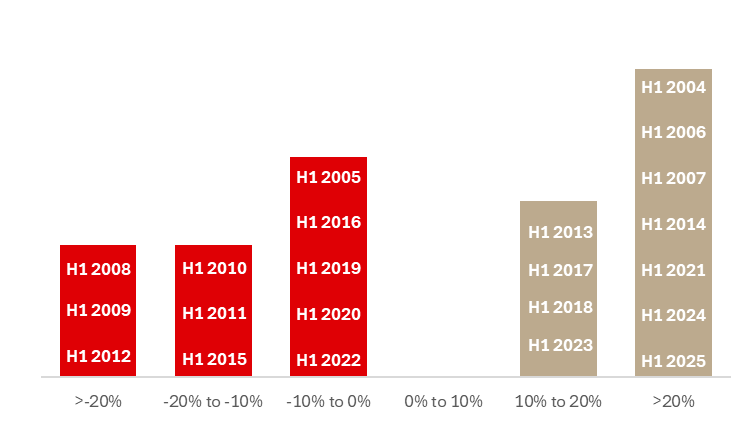
Source: Bloomberg, InterCapital
The S&P 500 shows a balanced profile. Most H1 results fall between 0 and 20 percent, reflecting steady mid-range gains. Deep negatives appear only in the shared global crises of 2008, 2009, and 2022, underlining that stress was macro-driven rather than local. What sets the S&P apart is the speed of recovery, supported by earnings breadth and the depth of capital. In recent years, large technology names have driven performance, but the index’s exposure to value sectors keeps volatility lower than Nasdaq. As a result, the S&P 500 remains the anchor for global equity investors, with H1 returns that are consistent, resilient, and central to setting market tone worldwide.
S&P 500 H1 YoY change (2004 – 2025, %)
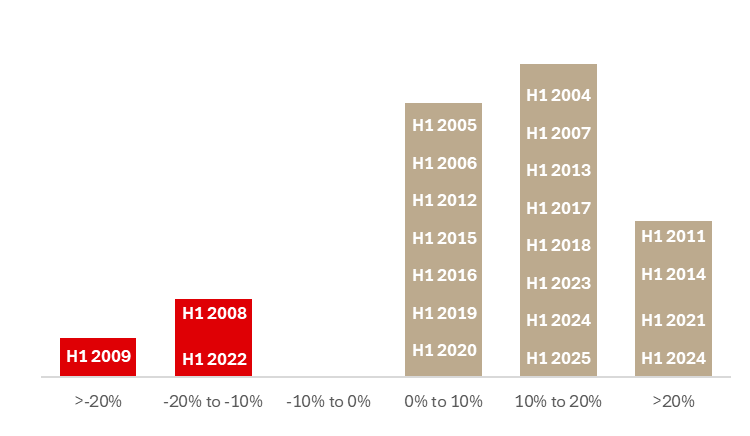
Source: Bloomberg, InterCapital
The Nasdaq 100 stands out with the fattest right tail. Many H1 results exceed 20 percent, while setbacks are concentrated in 2009 and 2022 during phases of multiple compressions. Growth cycles amplify both ways, but the overall skew remains clearly positive, making Nasdaq the most momentum-driven of the benchmarks.
Nasdaq 100 H1 YoY change (2004 – 2025, %)
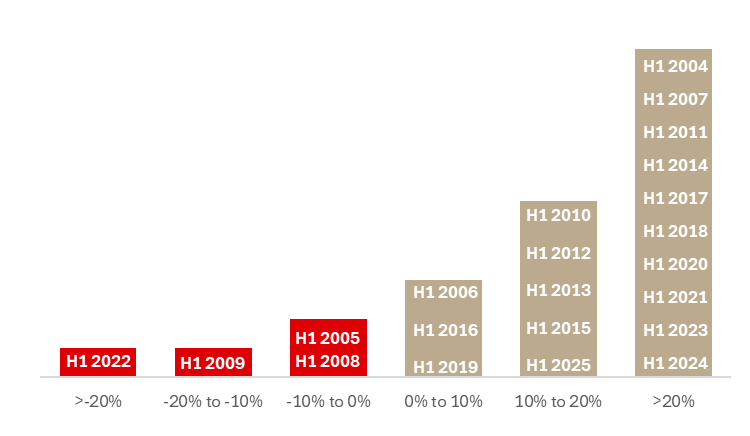
Source: Bloomberg, InterCapital
When comparing CROBEX and SBITOP with the EURO STOXX 50, the picture shows more similarities than differences. All three share the same crisis years and generally reflect the broader European cycle. The EURO STOXX 50 has a flatter profile, with most H1 results clustered around the middle, while CROBEX and SBITOP show a stronger right tail, delivering several 20 percent-plus halves in recent years.
Taken together, CROBEX and SBITOP behave much like the wider European benchmark, but with a recent track record of stronger bursts, proving that regional markets can match and at times even outperform Europe’s flagship index.
EURO STOXX 50 H1 YoY change (2004 – 2025, %)
Source: Bloomberg, InterCapital
Looking at the past two decades, one message is clear, quality and trading activity on both CROBEX and SBITOP have been steadily rising. In the last few years, these markets have not only matured but have also outperformed the broader EURO STOXX 50, showing that regional indices can deliver stronger bursts of performance when conditions align. For investors, this means our local benchmarks are no longer thin, peripheral stories but credible markets with depth and resilience. Placing them next to global peers underlines the contrast. The S&P 500 remains the global benchmark for a reason; its breadth of earnings and capital depth keep H1 results anchored in a stable mid-range, with rapid recoveries after shocks. The Nasdaq 100, on the other hand, shows the fattest right tail, reflecting its concentration in growth and technology stocks, delivering outsized gains in good years but also sharper corrections when valuations compress.
Together, the comparison shows that CROBEX and SBITOP now stand firmly in the European context, behaving closer to EURO STOXX 50 but with stronger upside in recent years, while the US benchmarks continue to define the global tone. The trajectory of our markets proves that regional exchanges can be both credible and competitive, offering investors a combination of European stability and local momentum.