Prevzemna ponudba za odkup delnic družbe Pokojninska družba A, d.d.
Axor holding, upravljanje družb, d.d., Slovenska cesta 56, 1000 Ljubljana, matična številka 8047847000, in EQUINOX NEPREMIČNINE, d.d., Dunajska cesta 5, 1000 Ljubljana, matična številka 8847657000 (v nadaljevanju skupaj: Prevzemnika), ki pri pridobivanju delnic Ciljne družbe delujeta usklajeno, skladno z Zakonom o prevzemih (Uradni list RS, št. 79/06, 67/07 – ZTFI, 1/08, 68/08, 35/11 – ORZPre75, 55/11 – sklep US, 105/11 – odločba US, 10/12, 38/12, 56/13, 63/13 – ZS-K, 25/14 in 75/15; v nadaljevanju: ZPre-1) obveščata, da je bila dne 29. 10. 2026 v njunem imenu in za njun račun objavljena prevzemna ponudba s prospektom za odkup delnic družbe Pokojninska družba A, d.d., Tivolska cesta 48, 1000 Ljubljana, matična številka 1640097000 (v nadaljevanju: Ciljna družba), z oznako PDAR in kodo ISIN SI0021111032. Prevzemno ponudbo je odobrila Agencija za trg vrednostnih papirjev z dovoljenjem št. 40201-2/2026-33 z dne 23. 10. 2026.
Prevzemna ponudba se nanaša na 81.737 delnic Ciljne družbe, to je na vse izdane delnice razen 7.750 delnic v lasti Prevzemnikov. Prevzemnika ponujata 401,00 EUR za delnico, plačljivo v denarju. Ponudba velja od vključno 30. 10. 2026 do vključno 28. 12. 2026. Prag uspešnosti znaša 95 % vseh delnic Ciljne družbe z glasovalno pravico, kar predstavlja 85.013 delnic. Ponudba vsebuje obvezni razvezni pogoj, vezan na pridobitev dovoljenja Agencije za zavarovalni nadzor za pridobitev kvalificiranega deleža v Ciljni družbi.
Elon Musk told SpaceX investors on 20 October that committees of independent directors at SpaceX and Tesla are evaluating a merger of the two companies. At about USD 2.1tn and USD 1.6tn of market value, the combination would be the largest corporate merger on record. SpaceX revenue rose 161% in the third quarter to USD 14.6bn, and its capital expenditure reached USD 19.6bn. Tesla revenue was flat at USD 28.0bn, with free cash flow of USD 1.5bn. A merger would put Tesla’s cash flow and shareholder base behind SpaceX’s spending plans, inside a share structure that gives Musk more than 80% of the votes at SpaceX.
Tesla presented the new Roadster at a SpaceX test site in Texas on 15 October. The top version, called Rocket, is listed on Tesla’s website with a “full flight system” and is available by invitation only, and a Thrust version carries cold-gas thrusters derived from SpaceX technology. Tesla quotes 60 mph in 1.6 seconds for the base car and a top speed above 230 mph. The company has announced no price, plans to start production in 2028 and does not expect high volumes, and some buyers have held deposits of up to USD 250,000 since the car was first announced in 2017. The Roadster will not be a material source of revenue for either company. Its thrusters are the most visible example of how much the two companies already share.
Tesla’s proxy filing this month lists USD 430m of Megapack battery sales to SpaceX data centres in 2025, USD 143m of vehicle sales to SpaceX and USD 3.3m of advertising that Tesla bought on X, the social network that now sits inside SpaceX. Tesla also holds a USD 2bn investment in SpaceX. The two companies are building Terafab, a chip plant in Texas, together with Intel, and run a robotics joint venture called Digital Optimus. Tesla’s chargers use Starlink connectivity, several executives hold roles at both companies, and one director sits on both boards.
Business between Tesla and SpaceX in 2025, and their joint projects
From Tesla to SpaceXFrom SpaceX to Tesla
Source: Company data, InterCapital Research
SpaceX revenue from its SI segment, which includes the AI business it absorbed in February, rose from USD 0.8bn a year earlier to USD 7.6bn in the third quarter and overtook connectivity revenue of USD 5.2bn. Connectivity revenue grew 69%. Starlink consumer subscribers rose from 7.2m to 13.6m, while average revenue per consumer subscriber fell from USD 83 to USD 69 a month. SpaceX reported operating income of USD 2.8bn against a loss of USD 0.3bn a year earlier, and net income of USD 4.4bn. The company guided first-quarter 2027 revenue to USD 33-37bn, more than Tesla reported in any of the past five quarters.
Quarterly revenue by segment, SpaceX and Tesla, Q3 2025 to Q3 2026, and SpaceX guidance for Q1 2027 (USD bn)
SpaceXSI (AI)Connectivity (Starlink)SpaceGuidance range
TeslaServices and otherEnergyAutomotive
SpaceX
Tesla
Source: Company data, InterCapital Research
SpaceX spent USD 19.6bn on capital projects in the third quarter, USD 16.4bn of it in the SI segment, and guides to USD 35-40bn for the fourth quarter. Capital expenditure for the first nine months reached USD 48.1bn, against USD 13.1bn of operating cash flow. The June listing raised USD 86bn and was followed by USD 25bn of new debt. SpaceX ended September with USD 89.9bn of cash and marketable securities and USD 38.8bn of debt and finance leases. Installed computing capacity in the SI segment reached 1.7 GW, from 0.6 GW a year earlier, against a target of 2.5-3 GW by the end of the year.
Tesla reported third-quarter revenue of USD 28.0bn, unchanged on a year earlier. Automotive revenue fell 3% and energy generation and storage revenue fell 16%, while services and other revenue, which includes self-driving subscriptions and the Robotaxi service, rose 33%. Paid self-driving subscriptions reached 1.74m, up from 1.04m, and 75% of vehicles delivered in the quarter carried one. Operating income fell 56% to USD 0.7bn as research spending rose. Operating cash flow of USD 6.3bn covered capital expenditure of USD 4.7bn, and Tesla lowered its full-year capital expenditure estimate to about USD 20bn from more than USD 25bn. Musk expects annual capital spending in the tens of billions of dollars by 2028.
Quarterly capital expenditure, SpaceX by segment and Tesla, with Tesla operating cash flow and Q4 2026 guidance (USD bn)
SpaceXSI (AI)ConnectivitySpaceGuidance
TeslaCapital expenditureImplied by full-year estimateOperating cash flow
Source: Company data, InterCapital Research
Tesla would bring about two thirds of the combined company’s quarterly revenue. SpaceX would bring about 80% of its operating income and capital expenditure and two thirds of its cash. Musk owns about 20% of Tesla, where individual investors hold around 30% of the votes, and controls more than 80% of the votes at SpaceX through the share structure adopted at its listing. An all-stock acquisition of Tesla by SpaceX, the structure several investors expect, would most likely leave him in control of the combined group. Musk has said Tesla shareholders will decide, and has described winning the support of half of Tesla’s shares as “quite a high hurdle”. Tesla’s large business in China adds a regulatory obstacle, given SpaceX’s ties to the US government.
Tesla and SpaceX shares of a combined company, by measure (%)
TeslaSpaceX
Source: Company data, InterCapital Research.
Published sum-of-the-parts valuations of SpaceX already apply very different multiples to its businesses, about 5 times revenue for the AI business and 58 times for connectivity. A carmaker with a 2.6% operating margin in the third quarter would add a third profile to the same share. The industrial case for the deal rests on products that do not yet sell at scale: Robotaxi and the Optimus robot at Tesla, with Optimus sales to outside companies targeted for the end of 2027, and the computing capacity and Starlink network that SpaceX would provide to run them. Terafab plans its first test chips next year and volume production in late 2028, a timetable Musk describes as carrying “big error bars”.
We would watch four things. The special committees have not named their members, and their recommendation will set the exchange ratio and any premium for Tesla shareholders. The Tesla vote requires the support of a majority of shares, on a register where individual investors carry weight. SpaceX’s fourth-quarter capital expenditure of USD 35-40bn will show how far its own cash flow and balance sheet can carry the build-out before Tesla’s cash joins it. Regulators in the US, the EU and China will each review a company that sells cars in China and works for the US government.
Ericsson Nikola Tesla Growth Switches to the Home Market
On Tuesday, Ericsson Nikola Tesla published its results for the first nine months of 2026. Sales revenue rose 23.3% YoY to EUR 204.2m, with growth in all three business segments, and contracted orders increased to EUR 231.5m from EUR 196.4m. Operating profit grew 11.6% to EUR 17.9m and net profit 9.0% to EUR 14.7m, while operating cash flow strengthened to EUR 23.6m. Most of the acceleration came in the third quarter, when sales reached EUR 73.2m, up 33.6% YoY and the highest quarterly figure since Q4 2024, although higher selling and administrative costs kept Q3 operating profit at last year’s level.
Breaking down revenue by market, domestic sales rose 61.7% YoY to EUR 69.2m (9M 2025: EUR 42.8m), making the domestic market the main source of growth. In Q3 alone, domestic sales reached EUR 30.1m, about twice the EUR 14.8m recorded a year earlier, driven by deliveries on the e-HZMO project for the Croatian Pension Insurance Institute. Deliveries also continued under the multi-year agreements with Hrvatski Telekom covering the radio access network, microwave equipment and the dual-mode 5G core, and under the new five-year contract with A1 Hrvatska, signed in Q2, under which Ericsson NT remains the sole supplier of A1’s radio access network and its maintenance provider. Sales to Ericsson grew 6.9% YoY to EUR 112.1m, while other export markets rose 27.2% to EUR 22.9m, with network expansion and modernisation work for HT Mostar, Crnogorski Telekom, Telekom Kosova and IPKO.
Ericsson NT quarterly sales revenue by market (Q1 2025 – Q3 2026, EURm)
Domestic marketExport marketsEricsson market
Source: Company data, InterCapital Research
By business segment, Software Engineering and Services, which covers R&D for Ericsson and services for Ericsson’s customers worldwide, remained the largest at EUR 112.1m (+6.9% YoY). The R&D centre took on additional responsibility for RAN Layer 1 and Layer 2 software development, extending its role in 5G and future 6G radio access networks. Telecom Solutions grew 33% to EUR 61.3m, and Digital Society more than doubled, rising 110% to EUR 30.8m. Digital Society recorded EUR 19.0m of sales in Q3 alone, against EUR 6.5m a year earlier, which makes the timing of the e-HZMO deliveries the largest single factor behind the quarter. Work on public sector projects in healthcare and land administration also continued, including the land registry information system in Cyprus.
Ericsson NT sales by business segment (9M 2025 vs 9M 2026, H1 and Q3, EURm)
9M 2025H1Q39M 2026H1Q3EUR m, change 9M on 9M
Source: Company data, InterCapital Research
Looking at profitability, gross profit rose 30.8% YoY to EUR 27.4m, lifting the gross margin to 13.4% from 12.6% on a higher share of high value-added work, with margins improving in Telecom Solutions and Software Engineering and Services. Selling and administrative costs rose to EUR 11.7m, or 5.7% of sales, reflecting stronger sales activity, investment in organisational capacity and the introduction of AI tools across the business. Operating profit increased 11.6% to EUR 17.9m, but the operating margin declined to 8.8% from 9.7%. In Q3, operating profit amounted to EUR 4.5m, broadly unchanged from EUR 4.6m a year earlier even as sales rose by a third, so the quarterly operating margin fell to 6.2% from 8.5%. Net financial income declined to EUR 0.2m from EUR 0.5m, and net profit rose 9.0% to EUR 14.7m, implying a return on sales of 7.2%.
Ericsson NT key financials (9M 2025 vs 9M 2026, EURm)
9M 20259M 2026EUR m
Source: Company data, InterCapital Research
On the balance sheet, operating cash flow rose to EUR 23.6m from EUR 13.7m, supported by the collection of receivables and the timing of new contracts. The Company repaid the remaining EUR 7.4m of borrowings and paid a dividend of EUR 13.52 per share, or EUR 17.8m in total, in July. Cash and cash equivalents, including short-term financial assets, stood at EUR 48.1m at the end of September (28.6% of total assets), against EUR 51.9m at the end of 2025, and the equity ratio was 40.2%. Working capital days lengthened to 53 from 43 a year earlier, as inventories rose to EUR 14.8m from EUR 10.8m at the end of 2025 on more complex customer projects, which remains the main item to monitor.
The domestic market data support continued network investment. According to HAKOM, 5G connections accounted for 47.7% of mobile broadband lines in Croatia in Q2 2026, up from 29.3% a year earlier, and mobile data traffic grew 35.1% YoY to 506 PB in the quarter. Hrvatski Telekom and A1 Hrvatska both have multi-year radio network agreements with Ericsson NT, which ties a large part of the Telecom Solutions pipeline to the continued 5G build-out.
Croatian mobile broadband lines by technology (Q1 2023 – Q2 2026, m, left), 5G share (%, right)
5G lines3G/4G lines5G share of mobile broadband (right)
Source: HAKOM, InterCapital Research
Looking ahead, management will focus in the final quarter on delivering contracted work and developing new business, in line with the ENT2030 strategy. Contracted orders of EUR 231.5m exceed nine-month sales by 13%, which gives good visibility into Q4 and 2027. The comparison base becomes tougher in Q4, when sales reached EUR 73.0m in 2025, against EUR 54.8m in Q3 2025. On the cost side, the factors to watch are the higher SG&A base, personnel costs, which rose 10.5% YoY to EUR 104.8m with around 2,900 employees, and working capital.
From a market perspective, ERNT shares have risen 16.5% over the past 12 months to EUR 219, while the CROBEX10 gained 24.1% over the same period. The shares went ex-dividend on 15 June. At the current price, ERNT trades at about 15x trailing twelve-month earnings and offers a dividend yield of 6.2% based on the EUR 13.52 dividend paid in July.
ERNT share price development vs CROBEX10 (October 2025 – October 2026, rebased to 100)
Bunds Shine as France Wobbles and Central Banks Loom
Last few weeks was marked by constant episodes of flight to safety, which was spurred by deteriorating fiscal situation in France but also fears of a broader AI selloff over concerns about further CAPEX sustainability of hyperscaler companies. Oil prices remained elevated into the weekend as the buildup of forces in the middle east rise the expectations of further joint US and Israeli strikes on Iran. This week is set to be more eventful (at least with regards to incoming data and central bank meetings), with several key central bank meetings and the upcoming elections in Israel on Tuesday.
Last week was marked by another episode of spread widening, in which the French 10Y spread (OAT vs. Bund) reached almost 177bps. What ensued was another flight to safety episode with a wave of selling pressure in OATs and subsequent rotation in to “safe haven” assets such as Bunds or USTs. This was also reflected in Bund options volatility, which rose again and remained elevated throughout the week. Notably, the volatility in OAT options is still heavily skewed to the put side, reflecting the demand for hedging. So far, further contagion in periphery markets remains relatively contained. French spreads tightened versus Bunds, after Moodys kept its rating unchanged on Friday evening providing some support until the budget crisis is resolved. Markets remain on the very edges of their seats until November 27th when S&P is expected to deliver its verdict on the French credit rating. Notice that this rating agency holds A+ with a stable outlook, so a rating downgrade before the budget is passed seems a bit unlikely.
This week also brings several key central bank meetings. Notably, on Wednesday we will have the FOMC meeting, where the Fed will decide whether to hold or raise rates. Market is currently pricing a 90% chance of a hold on Wednesday, so any deviations should remain remote even after the lates CPI print came in hotter than expected. What will be interesting to watch is the statement, and most importantly, the tone of the press conference, where we will again try to find clues as to what Chair Warsh has in store for the December meeting (where the market is pricing in a final hike this year). The AI facilitated selloff also adds another dimension for the FED path, as it did spur discussions of a slowdown in economic growth, as concerns over future hyperscaler CAPEX sustainability mount. The US 10Y remains under the 5% level, trading at 4.98% in yield terms.
ECB (on Thursday) is also widely expected to hold rates (market pricing 97% for hold). Recent episode of spread widening in France sparked fears of further periphery contagion, prompting questions of future ECB involvement. Deteriorating situation in France presents a challenge for the ECB, as the monetary policy transmission mechanism in the Eurozone is different than that of other countries, and can skew ECBs reaction function to remain more dovish than previously expected, although this remains to be seen. Currently, the main concern for the ECB remains the ever-looming risk of second-round inflation effects, which still appear to be contained (although further data will be needed to assess the spillover effects of the energy crisis). Elevated energy prices into the winter, and further release of emergency diesel reserves could prove to be detrimental for European governments, putting additional strain on already strained budget deficits, especially in more energy dependent nations. To add to this, current European gas storage is at 75% capacity. The German 10Y Bund sits around the 3.4% and is currently trading at 3.37% in yield terms.
As already mentioned, this week we will be receiving more data points than the quieter last week, with several key central banks included. To start the week, we will observe the US 2Y note auction on Monday evening. Tuesday’s Durable Goods orders, CB Consumer Confidence for October and New Home Sales for September will shed some light on the US consumer and the housing market. Wednesday we will be closely watching the Fed decision and the subsequent FOMC press conference (this week an hour earlier than usual due to the time change…). Thursday brings us the US GDP, and PCE, where we will see the trajectory of US inflation, and the state of the economy. This is followed by the ECB rate decision, and closely after, the press conference. To close the week, on Friday, we have the BoJ rate decision, followed by German CPI and GDP numbers, and Chicago PMIs in the afternoon.
More Boxes, Same Suitcases: Croatian Ports and Airports in 2026
Ports and airports rarely make the headlines, but in 2026 they deserve a closer look. Croatian ports had their busiest first half in more than a decade, Rijeka handled more containers than ever before, and the airports kept growing. Here’s what the numbers are telling us, with the usual disclaimer that statistics, like ferry timetables, should be read carefully.
Firstly, looking at the broad picture, Croatian seaports handled 12.39m tonnes of cargo in the first half of 2026, up 20.8% YoY. Containers did the heavy lifting: Rijeka alone handled 404.6k TEU (3.84m tonnes of goods), up 70.4% YoY, which represents roughly 95% of the containers moving through Croatia. The official DZS first release for Q2 makes the same point: containerised goods were up 82.9% YoY in the second quarter alone and now make up 35% of all tonnage handled in Croatian ports. Sea passengers, at 13.12m, were flat to the decimal point (+0.04%). Airports carried 10.25m passengers in January to August, up 2.3% YoY. So: freight is sprinting, sea passengers are stable, and airports are walking at a comfortable pace, all at record levels.
Let’s start with Rijeka, because a 70% jump in half a year is not something you see often in port statistics, which usually move at the speed of a tugboat. The explanation has a name: Rijeka Gateway, the new container terminal on the Zagreb pier, which started commercial operations in September 2025. Rijeka now has two container terminals competing for calls, and the shipping lines have noticed. To put the jump in context, Rijeka averaged roughly 35k TEU a month in 2024. In May 2026 it handled 82.8k TEU. The full year 2025 was already a record at 512.9k TEU (4.69m tonnes, +22.6% YoY), and the first half of 2026 alone is about 79% of that number. Between 2015 and 2025 the port grew at a 12.9% CAGR, which was already respectable. 2026 is a different gear.
Rijeka container throughput, TEU (thousands)
Source: DZS, InterCapital Research
Rijeka Gateway deserves a few lines on its own, because it is the biggest private port investment Croatia has seen in a very long time. It’s a joint venture of APM Terminals (part of the Maersk group, 51%) and the Croatian ENNA Logic (49%), which signed a 50-year concession for the terminal in November 2021. Phase one has a 400m quay and capacity of about 650k TEU a year (TEU, or twenty-foot equivalent unit, is how the industry counts boxes: a 20-foot container is one TEU, a 40-foot one is two). Phase two takes it above 1m TEU. It’s worth being precise about who paid for it. The private partners are investing around EUR 380m, a bit over EUR 200m in phase one and about EUR 180m in phase two, while the state put in around EUR 187m, mostly through a World Bank loan, plus EU co-financing for the quay, roads and rail links. For phase one that’s roughly a 50/50 public-private project, and across both phases the total comes to around EUR 600m. Maersk then moved its AE12 Far East service (with Hapag-Lloyd) from Trieste to Rijeka. AE12 is a regular container line, run with Hapag-Lloyd, that links the Adriatic with Port Said in Egypt, where cargo connects to the big ships sailing to and from Asia. The biggest shipping group in the world brought its own ships to its own terminal, which, as business plans go, is a pretty reliable one.
The quality holds up too. Rijeka’s empty container share in Q2 was 20.6%, slightly below last year (21%), and in tonnes, which ignore empty boxes, growth was even stronger at +73.8%. Outbound boxes rose 84% YoY, inbound 58%. According to Port Authority data reported by Novi list, Rijeka Gateway handled about 206k containers in H1, more than half of the port’s total, while the older Jadranska vrata terminal at Brajdica was down around 24% YoY. In other words, the new terminal is both growing the pie and taking a slice of the old one.
Across the North Adriatic, Koper remains the undisputed number one with 1.25m TEU in 2025 (+11.8% YoY). Trieste fell to 579k TEU (-24% YoY), and losing AE12 at the end of the year didn’t help. Venice was flat at 564k. In Q1 2026 Rijeka handled 175k TEU, ahead of both Trieste (169k) and Venice (107k) in the same quarter for the first time, and Q2 brought 229k TEU. In tonnes Rijeka was still a whisker behind Trieste in Q1, since its boxes are lighter, but on a trailing four-quarter basis to Q1 2026 it’s already at 46% of Koper’s TEU volume, a ratio that would have sounded like a typo five years ago.
North Adriatic container ports, TEU per quarter (thousands)
Source: Eurostat, InterCapital Research. Each country reports on its own calendar; Q2 2026 available for Rijeka only.
This isn’t a zero-sum game. Koper kept growing too, a sign that the whole North Adriatic is gaining share as Far East services get reshuffled. In H1 2026 it handled 656k TEU (+5% YoY, 6% above plan), while revenue rose to EUR 206.1m (+10%), EBITDA to EUR 73.3m (+7%, 30% above plan) and net profit to EUR 48.1m (+11%). H1 EBIT already covers about 79% of the full-year plan, so the conservative budget is looking very conservative indeed. The soft spots were cars (-9%) and dry bulk, held back by rail capacity. Koper is also investing heavily: capex hit EUR 91.6m in H1 (+70%), led by the roughly EUR 153m Pier I extension, due by end-2027, which should lift container capacity to about 1.8m TEU. Both neighbours are building bigger garages and hoping Central European demand parks on their side of the border.
The market noticed. LKPG trades at EUR 116, up 61% YTD and 78.5% over a year, with a EUR 2.30 dividend paid in August. For a port operator famous for being steady rather than exciting, that’s quite a rerating, and Koper shareholders have had a year in which the most stressful decision was what to do with the dividend.
Back home, the headline +20.8% in cargo needs a footnote. Strip out Rijeka and Omišalj and the rest of the ports moved about 4.24m tonnes, down roughly 6% YoY. Omišalj, JANAF’s crude terminal, had a strong half with 4.03m tonnes (+22.9%), as more of the region’s crude arrives by sea. Elsewhere it was greyer: Ploče -2.5%, Bakar -7.7%, Split -3.0%, Raša -18.1%, and coal collapsed from 581k to 114k tonnes. Dry bulk overall fell 31.5%.
Cargo by port, H1 2025 vs H1 2026 (million tonnes)
Source: DZS, InterCapital Research
Passengers are calmer. Seaports handled 13.12m in H1, exactly in line with last year. One statistical quirk: DZS counts every ferry passenger twice, once when they leave Split and again when they arrive in Supetar. Anyone who has queued for the Split ferry in July would swear the real crowd is even bigger than that. Split led with 2.01m (+1.0%), ahead of Zadar (1.13m) and Dubrovnik (1.09m, -2.7%). The ferry network is mature: the islands aren’t getting bigger, and neither is the season. Cruise is where the growth is, with 597k passengers in H1 (+16.6% YoY), 42% of them in Dubrovnik. 2025 ended at 1.62m, already 7% above 2019, so another record looks likely, which Dubrovnik will probably see as a mixed blessing.
Cruise passengers in Croatian ports, January to June (thousands)
Source: DZS, InterCapital Research.
Up in the air, Croatian airports carried 10.25m passengers in January to August according to DZS, up 2.3% YoY, with the six big airports about 26% above 2019, after a record 2025. Still up, but flatter. Zagreb is the biggest airport this year at 3.15m (+1.8%, 139% of 2019) and the only one that isn’t a summer business. Split slipped to 2.81m (-1.1%), Dubrovnik grew to 2.33m (+4.2%), and Zadar keeps proving low-cost carriers can rewrite a map at 230% of 2019. Pula is still at only 73% of 2019, while Rijeka (Krk) grew fastest at +17.6%, from a small base.
Airport passengers, January to August (thousands)
Source: Eurostat, InterCapital Research.
In June to August, Split and Dubrovnik ran at 109% of 2019. With beaches, hotels and the Split ferry all full in August, growth has to come from June, September and October, and from the bill rather than the headcount. For Arena, Valamar and Maistra, 2026 is about pricing, costs and a longer season, not more guests. A more demanding game, but not a bad one.
So what does it all mean for investors? The biggest story of 2026 isn’t on the beach, it’s in the cranes. The North Adriatic is turning into a serious gateway to Central Europe, and the money going in says the people who know the business agree. Koper is the clearest listed winner, with record volumes, earnings above plan and a share price that has finally priced some of it in. Rijeka is the year’s breakout: if the Q2 pace holds, 2026 could land well above 800k TEU (our rough inference, not a forecast). Omišalj and JANAF are quietly cashing in on energy security, and tourism is posting near-record numbers while shifting from volume to value.
The risks are real, though. Rail is the bottleneck both ports mention whenever someone hands them a microphone, with Rijeka waiting on the lowland railway to Zagreb and Koper on its second track to Divača. And tourism is near capacity in peak months, so a weak season would show up fast. Still, if we had to sum up 2026 in one sentence: the Adriatic is no longer just where Europe goes on holiday, it’s increasingly where Europe’s goods come ashore. For a region long described as “too small and too far”, that’s a pretty good place to be.
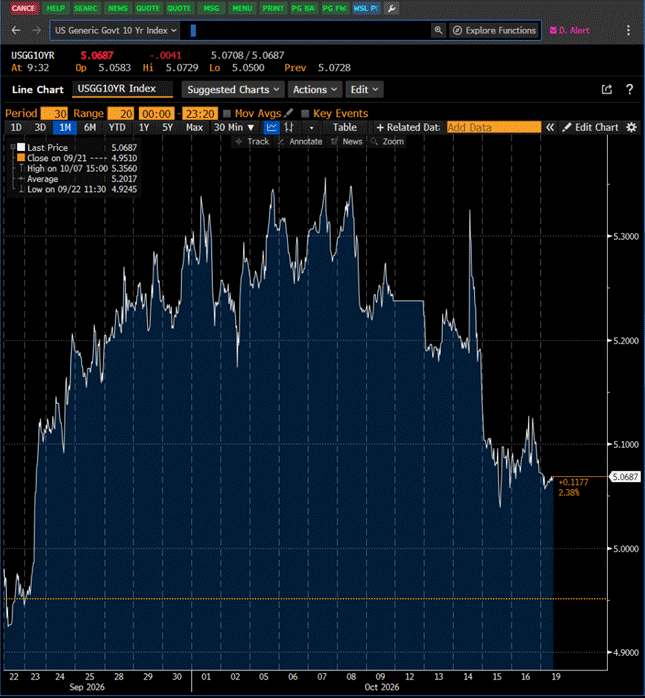
The US 10-year has had a loud month. An auction that needed the highest yield since 2000, a hot inflation print and a sharp selloff in tech stocks all came within a few weeks, and the yield covered a range of more than 40bps. Yet it sits only about 12bps above where it was a month ago. Zoom out to the one-month chart and it almost looks quiet.
US 10-year Government bond yield
Source: Bloomberg, InterCapital
Earlier this month, The Macro Compass described the bond market as searching for new clearing levels, the yields at which buyers finally step in with enough size to slow the selloff. Their view is that with inflation above target and deficits still supporting demand, yields keep rising until tighter financial conditions hit equities and do the job policymakers will not. They also make a point worth keeping in mind: reaching an equilibrium level does not mean bonds have to rally.
On the 10-year, 5% has played the role of that line. It held as a ceiling for most of September, broke on September 23rd, and the yield spent early October above it, peaking on the day of the 10-year auction.
The loudest stretch came in the week of October 12th, and it looked like that scenario in fast forward. September CPI came in above expectations, with services prices still firm, and yields pushed back toward the highs. Within hours, a sharp drop in AI and chip stocks sent money into Treasuries, and by the next morning the 10-year was almost 30bps below its post-CPI high. Equities did the tightening and bonds got the bid. The rally stopped short of 5%, and the week closed a little above it.
Options help put a number on this. The simplest volatility trade is a straddle: buying a call and a put with the same strike and expiry. Direction does not matter. If the future rallies, the call pays, and if it sells off, the put pays. The two premiums together are the cost and also the break-even, so the future has to move by more than that, either way, for the trade to make money at expiry.
Take the December options on the 10-year future (TYZ6), which expire on November 20th. With the future around 105-22, the 105.5 call costs a little under one point and the put about three quarters of a point. Together, the straddle costs about 1.66 points, which translates into roughly 27bps of yield. That is the average move the market expects over the next 32 days, a window that includes the FOMC on October 28th and the ECB a day later. It also ties back to implied vol: as a share of the futures price, an at-the-money straddle costs about 0.8 × implied vol × √time, and with implied vol around 6.6%, that is where the price lands.
Now apply the same logic to the past month. A buyer of a one-month straddle in late September paid for a move of similar size. A month later the yield is only about 12bps away, so without hedging, the trade lost money. A buyer who hedged along the way, buying the future on dips and selling it into rallies, had a much better month, because every swing inside that 40bps range was something to trade against. Where the yield ended up was not the story. How it got there was.
This is the uncomfortable part of owning straddles. Even at a fair price, and if moves are roughly normal, the buyer only wins in around 42% of cases, because the move has to be bigger than about 0.8 standard deviations. The good months pay for the bad ones, but more than half end like this one.
This brings us back to the clearing level. If 5% is where buyers now step in, the past month was the market finding it, and a flat one-month chart is what that looks like from a distance. But if equilibrium does not guarantee a rally, the next push higher can come from the same places as before: inflation that is not slowing, a Fed that offers little guidance, and a steady supply of new debt. Options are pricing about 27bps for the next month. Whether that comes as another round trip around 5% or a clean break away from it is what the next few weeks should tell us.
ASML, the largest company in Europe by market cap (approx. EUR 580bn), has been one of the most important players in the chips and semiconductors industry, producing machines that allow for cutting-edge semiconductor production on silicon wafers, the most important material in chip production. While we often hear about American and Asian companies dominating the tech space, a lot of this advantage would not be possible without ASML and its machines. In this blog, we bring you a detailed overview of the Company.
First, a little bit of context. ASML is a Dutch semiconductor equipment manufacturer, established in 1984, but unlike companies such as Nvidia, AMD, or Intel, it does not design or manufacture chips itself. Instead, the Company builds the machines that semiconductor manufacturers use to produce them. Its core technology is lithography, a process of projecting extremely small patterns onto silicon wafers, which are then gradually turned into the transistors and electrical connections that make up a semiconductor.
As such, the Company’s portfolio is centred around Deep Ultraviolet (DUV) and Extreme Ultraviolet (EUV) lithography systems. In this case, DUV is a more mature technology and remains widely used across both advanced and older semiconductor manufacturing processes, while EUV is required for many of the most demanding layers in leading-edge chips.
Recently, ASML also started introducing High Numerical Aperture Extreme Ultraviolet (High-NA EUV), its next-generation technology designed to enable even smaller features and future semiconductor nodes. Lastly, besides lithography, ASML also sells metrology and inspection equipment used to measure and control the manufacturing process. As a point of comparison, in 2025, the Company sold 48 EUV, 279 DUV, and 208 metrology and inspection systems.
How a chip is made
Inside wafer fabrication:
the process is repeated
layer by layer
Repeated many times
Deposit →
lithography →
etch →
inspect →
repeat for the next layer
STEP 1 OF 11
Chip design
Companies such as NVIDIA, AMD,
Apple and Qualcomm design the
architecture and functionality
of the chip. They determine what
the semiconductor should do
before the physical manufacturing
process begins.
STEP 2 OF 11
EDA and physical layout
Electronic Design Automation
software from companies such as
Synopsys and Cadence converts the
chip design into an extremely
detailed physical layout that can
ultimately be manufactured on
silicon.
STEP 3 OF 11
Silicon wafer
Shin-Etsu, SUMCO and GlobalWafers
manufacture ultra-pure and highly
polished silicon wafers. These
circular wafers provide the
physical base on which the
semiconductor structures are
built.
STEP 4 OF 11
Deposition
Equipment from Applied Materials,
ASM International and Tokyo
Electron deposits extremely thin
layers of material onto the wafer.
These layers will eventually form
parts of the transistor and its
electrical connections.
STEP 5 OF 11
ASML lithography
This is where ASML enters the
process. Its Deep Ultraviolet
(DUV), Extreme Ultraviolet (EUV)
and increasingly High Numerical
Aperture EUV systems project
extraordinarily small circuit
patterns onto the wafer. For
leading-edge semiconductor
manufacturing, EUV lithography
has become one of the most
technologically critical parts
of the entire production chain.
STEP 6 OF 11
Etching
After lithography determines where
microscopic structures should be
created, etching equipment
selectively removes material from
the wafer. Lam Research, Applied
Materials and Tokyo Electron are
among the largest suppliers in
this part of the process.
STEP 7 OF 11
Inspection and process control
KLA and other process-control
suppliers inspect the wafer for
microscopic defects and measure
whether each newly created layer
is positioned correctly. Even
extremely small errors can
materially reduce production
yields.
STEP 8 OF 11
Semiconductor foundry
TSMC, Samsung and Intel operate
semiconductor fabs containing
equipment from ASML and many other
suppliers. They combine
lithography, deposition, etching,
cleaning, implantation and
inspection into hundreds or
thousands of manufacturing steps.
STEP 9 OF 11
Wafer dicing
Once fabrication is complete, a
single wafer contains many copies
of the semiconductor design. The
wafer is cut into individual dies,
each of which can later become a
CPU, GPU, memory chip or another
type of semiconductor.
STEP 10 OF 11
Packaging and testing
Individual dies are packaged,
connected and tested. TSMC, ASE,
Amkor and equipment suppliers such
as BESI participate in this stage.
Advanced AI systems increasingly
combine multiple chips and High
Bandwidth Memory within a single
sophisticated package.
STEP 11 OF 11
Finished semiconductor
The finished product can be a CPU,
GPU, AI accelerator, High Bandwidth
Memory chip or smartphone
system-on-chip. These semiconductors
ultimately power data centres, PCs,
smartphones, vehicles and other
electronic devices.
By segment, the Company reports only one operating segment, as the Company’s Management views the Company as a single provider of holistic lithography solutions. However, looking at it more closely, we can distinguish two main revenue streams: System Sales and Installed Base Management (IBM), also called net service and field option sales. System sales include new and used lithography, metrology and inspection equipment, while Installed Base Management consists of services, spare parts, software, productivity upgrades and other improvements made to machines already operating at customer fabrication plants (fabs).
This 2nd part of the business is becoming more and more important. During 2025, ASML generated EUR 24.5bn from system sales, an increase of 12% YoY, and another EUR 8.2bn from IBM revenues, an increase of 26% YoY, driven by a larger installed base, higher equipment utilization and upgrades to existing EUV systems.
ASML revenue breakdown by category (EUR bn), total revenue growth YoY (%) (2020 – 9M 2026*, %)
System sales
Installed Base Management
Total revenue
YoY growth
Source: ASML, InterCapital Research
*9M 2026 YoY calculated versus 9M 2025
During 9M 2026, the strong growth continued, with total revenue reaching EUR 29.8bn (+30% YoY), with net system sales reaching EUR 21.2bn, up 25.6% YoY, while IBM sales reached EUR 8.54bn, a 40.9% increase YoY, also exceeding 2025’s revenue in this segment by 4%. If we look at a longer time period, the revenue expansion is even more noticeable. From 2020 up until 2025, revenue grew by 133%, implying a CAGR of 18.5%, with revenue during 9M 2026 more than double the FY level in 2020.
Top line isn’t the entire story, however, as the Company’s EBITDA expanded even more significantly, growing from EUR 4.5bn in 2020 to EUR 12.3bn in 2025, almost 3x during the period, with the 9M 2026 EBITDA exceeding EUR 12.6bn, meaning that just during those 9 months, almost three times the EBITDA was made compared to the entire year 2020. This would also imply an EBITDA CAGR of 22% per year. This also points towards the significant operating leverage the Company has, with profitability continuing to scale faster than the top line.
However, the increase was far from linear. The strongest growth initially occurred in 2020 and 2021, during semiconductor shortages, growing digital infrastructure investment and strong logic and memory demand. This supported both the top and operating lines. In 2022, revenue growth continued, although the gross margin did decrease somewhat, weighed down by costs related to increasing production capacity, inflationary pressures and shipment/revenue-recognition dynamics.
2023 marked another strong step forward, followed by a transition year in 2024 and renewed acceleration in 2025. During these years, EUV adoption by cutting-edge logic and memory manufacturers was becoming an increasingly important structural driver. 2025 added an additional boost as leading-edge foundry investment related to AI demand accelerated. With the strong demand from AI, many components of a modern PC started to record strong price increases, something that was most documented in DRAM, which recorded triple-digit price increases in certain categories during the last 18 months alone. This was also supported by memory producers reallocating capacity towards HBM and advanced server memory, tightening the supply of conventional DRAM.
ASML net income (EUR bn), net income margin (%) development (2020 – 9M 2026)
Net income
Net income margin
Source: ASML, InterCapital Research
The trend continued in 2026, with all three main financial lines growing at double-digit levels at ASML (revenue +30%, EBITDA +45%, net income +57%). The net income growth was also partly supported by an EUR 510m gain on equity investments during Q3 2026. For the entire year, the Company expects revenue of EUR 44-45bn, which would imply an increase of 35-38% YoY, together with a gross margin of approx. 56%. The Company’s Management also recently stated that customers continue to raise their short- and medium-term equipment forecasts, primarily due to expectations surrounding the size and duration of the AI investment. They also noted that some customers are already discussing orders for 2029 and 2030, while ASML also believes that its planned production capacity for both 2027 and 2028 may be insufficient to meet demand. Because of this, the Company is examining further capacity additions for 2028 beyond the previously communicated 30% increase.
One other point worth noting is how fast this growth has occurred, especially compared to the Company’s own expectations. During its 2024 Investor Day, they outlined a 2030 revenue opportunity of EUR 44-60bn, with a gross margin of 56% to 60%. With the lower end of this 2030 range within reach in 2026 already, it would mean that the Company could effectively reach the bottom of its previously outlined 2030 range 4 years earlier.
In general, the underlying growth story is built around several mutually supporting drivers. AI requires increasing quantities of leading-edge Logic chips and HBM (High Bandwidth Memory), which in turn encourages TSMC, Samsung, Intel, SK hynix, Micron, and others to expand advanced semiconductor capacity. At the same time, new manufacturing nodes require greater lithography intensity, supporting additional EUV demand. High-NA EUV also provides ASML with another technology upgrade cycle, while every additional system sold expands the installed base from which the Company can generate recurring service and upgrade revenues.
Compared to its peers, ASML sits within the broader semiconductor equipment industry alongside companies such as Applied Materials, Lam Research, KLA, Tokyo Electron and ASM International, although due to the difference in the businesses’ structure, they should not all be considered direct competitors. Applied Materials, Lam and Tokyo Electron are strong in deposition and etching; KLA focuses primarily on process control and inspection, while ASM International has a strong position in atomic layer deposition. ASML, meanwhile, is strong in lithography, and most importantly, it has a unique position in EUV.
Profitability comparison between ASML & peers (Latest data*, %)
Gross margin
Operating margin
Source: Companies’ data, InterCapital Research
*ASML 9M 2026, KLA and Lam FY 2026, Applied Materials Q3 FY 2026; the companies have different reporting periods, and as such the numbers should be treated as indicative of profitability between these companies.
Within its peer group, ASML is not the only one with good profitability. KLA, for example, has slightly higher gross and operating margins. What differentiates ASML is how that profitability is earned. In most semiconductor equipment categories, several suppliers compete for customer spending. In leading-edge EUV lithography, ASML occupies an effectively unique position. This makes its products extremely hard to substitute and gives the Company exposure not simply to growth in semiconductor CAPEX, but also to the increasing technological complexity of each new generation of chips.
ASML, AEX index price performance (2020 – 2026 YTD, 2020=100)
ASML
AEX
Source: Bloomberg, InterCapital Research
Nobody can say this is an unknown stock, however. The exposure the Company has been getting has been reflected strongly in its share price, with the price standing at around EUR 400/share at the end of 2020, and it grew all the way to EUR 1,477 per share as of 16 October 2026, an increase of more than 270% during that period. As a point of comparison, the AEX index grew by only 83% during that same time frame.
Overall, ASML presents a compelling case of a European company that has been integrated into some of the most important supply chains in the world. We often hear about Nvidia or AMD and their chips, particularly CPUs or GPUs, or about Apple or Samsung and their phones. We also hear about TSMC and how, without its semiconductor manufacturing capabilities, the entire technological advancement couldn’t occur.
What we often don’t hear about is the silent engine at the heart of this chain. Without the advanced lithography machines, none of these advancements could be possible. With the strong AI demand and billions, if not trillions, that are to be spent on it in the next couple of years, the demand is astounding. ASML continues to invest and grow. Unlike many companies which got replaced by AI in the last couple of years, ASML’s MOAT is huge and unlikely to be broken, similar to the dams that surround and secure the country of its origin.
Trading After Stock Splits in Croatia and Slovenia
Seven stock splits on the Zagreb and Ljubljana stock exchanges between 2018 and 2025 provide a useful test of what a lower share price changes in practice. Our estimates point to roughly twice as many trades per day and around 29% smaller transactions relative to control stocks. The largest activity increases came from previously thinly traded shares, while Euro turnover and quoted spreads changed less consistently.
A stock split increases the number of shares and reduces the price per share proportionately. A 1:10 split would turn one share priced at EUR 200 into ten shares priced at EUR 20, before subsequent market movements. The shareholder’s holding would still be worth EUR 200, so the split itself changes neither the company’s underlying business nor the investor’s percentage ownership.
A lower price can nevertheless make smaller purchases easier where investors buy whole shares. The question for trading is whether that change brings more transactions, more money through the order book, or better prices for buyers and sellers. These outcomes need to be measured separately.
Recent stock splits in Croatia and Slovenia
Company
Exchange
Ratio
Split month
Plava laguna
ZSE
1:4
Jan 2018
Čakovečki mlinovi
ZSE
1:98
Oct 2021
Atlantic Grupa
ZSE
1:4
Jul 2022
Cinkarna Celje
LJSE
1:10
Aug 2022
Petrol
LJSE
1:20
Nov 2022
Salus
LJSE
1:78
Jun 2025
Bosqar
ZSE
1:10
Sep 2025
Source: Issuer announcements, ZSE, LJSE, InterCapital Research
We compare each company’s trading with shares on the same exchange that did not split, using the 12 months before and after the event and excluding the split month. This helps account for broader market movements, while daily data provides a separate check around each split. Trade counts and euro turnover are more informative than unadjusted share volume, as after a 1:10 split, the same investment involves ten times as many shares even if investor behaviour is unchanged, so the rise in the number of shares traded can therefore be entirely mechanical.
Estimated changes in trades per day relative to control stocks (12-month windows, %)
Source: ZSE, LJSE, InterCapital Research
12 months before and after each split, excluding the split month. Whiskers show approximate 95% confidence intervals. *Other corporate or trading changes coincided with the split. Percentage effects are approximate transformations of log-model estimates; data to 2 October 2026.
Salus and Bosqar recorded the largest increases relative to controls, approximately 598% and 416%. Atlantic Grupa showed a small increase, while Petrol’s estimate was negative. Shares with very low trading activity before the split generally recorded the largest gains.
Other changes complicate that pattern. Salus moved from call auctions to continuous trading and added a market maker around the same period. Bosqar experienced other corporate changes, and its market-making mandate ended in December 2025. Petrol’s pre-split period included exceptional trading during the energy crisis. The observed changes cannot all be attributed to the split alone.
The pooled estimate suggests approximately twice as many trades per day relative to controls. Seven events provide limited statistical power, and confidence depends on the testing method. A correction for small samples puts the p-value at about 0.056, just above the conventional 5% threshold. The estimate is not a forecast for the next issuer.
Trading around the split date (months from split, pre-split average = 100)
Source: ZSE, LJSE, InterCapital Research
Monthly order-book activity per trading session, including zero-trade sessions. Each stock is indexed to its own pre-split 12-month mean. Controls are same-exchange sample stocks with no recorded split and complete trading-session coverage, equally weighted within each group, then the seven events are equally weighted. Month 0 is omitted. Descriptive averages are strongly influenced by Salus and Bosqar, which had concurrent changes; they are not the pooled model estimates.
The estimates also point to smaller transactions and more sessions with trading. Average transaction value was approximately 29% lower relative to controls, while the share of sessions with at least one trade was about 17 percentage points higher. More frequent, smaller transactions are consistent with broader participation. The data does not identify investors, so it cannot establish whether new retail investors entered the market.
Euro turnover shows a less clear pattern. Its pooled estimate is positive but imprecise, and the research does not establish a consistent increase. Trading can become more frequent while the amount invested in each transaction falls. More transactions therefore need not mean a proportionate increase in the money traded.
Median month-end quoted spreads before and after splits (12-month windows, % of mid-price)
Source: ZSE, LJSE, InterCapital Research
12 months before and after each split, excluding the split month. *Salus also changed its trading model.
Quoted spreads also changed unevenly. Median month-end spreads narrowed in four cases and widened in three. The estimates relative to controls do not establish a clear overall reduction. These observations are snapshots of the gap between buying and selling quotes, rather than a complete measure of execution costs throughout each trading day.
The minimum price increment, or tick, helps explain why a lower share price need not produce a narrower spread as a percentage of price. European tick rules depend on both the share price and its liquidity band. A split changes where the share sits in the price grid. The percentage increment can rise, fall or remain similar.
Petrol's calculated tick represented approximately 0.21% of the share price before the split and 0.45% afterwards, using window-average prices and liquidity bands inferred from trading activity. Its median quoted spread nevertheless changed little, from about 1.12% to 1.06%. The lower nominal share price did not mechanically reduce the relative minimum price increment.
Market making across three continuously covered split cases (12-month windows)
Company
MM turnover share Before → after
MM quoted spread Before → after
Atlantic Grupa
41.0% → 35.9%
1.70% → 2.12%
Cinkarna Celje
35.2% → 47.0%
2.18% → 1.80%
Petrol
21.1% → 29.7%
1.54% → 1.49%
Source: ZSE, LJSE, InterCapital Research
12 months before and after each split, excluding the split month
Market makers' turnover share fell at Atlantic Grupa and rose at Cinkarna Celje and Petrol. Their average quoted spreads also moved differently. Comparisons with controls do not establish a common change in participation. A turnover share is a relative measure and can rise when other trading declines.
The regional evidence associates splits with more frequent trading, particularly among previously thinly traded names. For subsequent splits, we would watch whether that increase persists and whether euro turnover and spreads improve alongside it, while accounting for changes in trading arrangements and market-making coverage.
Last week, Schneider Electric agreed to acquire US engineering software company PTC for USD 205 per share, valuing the equity at USD 22.6bn and implying an enterprise value of USD 23.7bn. At first glance, an electrical equipment company making its largest acquisition in software might look like yet another attempt to bolt AI into an established industrial business, but the strategic logic runs considerably deeper.
The deal is one of the clearest signals yet of where industrial technology is heading. Electrification, automation, software and AI are increasingly converging into a single stack, or put differently, industrial value is migrating from the box to the stack. Hardware leaders are buying software to own the data layer and the recurring revenue that sits on top of it, while the physical bottleneck, and with it most of the near-term pricing power, remains in hardware. Rather than dwell on the transaction itself, we want to use it as a lens on how the industry is likely to evolve.
Schneider Electric’s major software and digital acquisitions (USD bn)
Source: Schneider Electric, InterCapital Research
Values represent headline transaction/company valuations and may refer to equity value or enterprise value depending on transaction disclosure. AVEVA represents the implied value of 100% of the company, although Schneider Electric already owned c.59% prior to the 2022 transaction. OSIsoft was acquired by AVEVA while Schneider Electric was its majority shareholder. Invensys and Shelly Group include broader automation/IoT activities in addition to software.
PTC is not Schneider’s first move of this kind. Invensys and AVEVA brought process automation and software for running plants. Cognite, agreed in June, adds an industrial data and AI layer. Shelly, the Bulgarian smart-device maker, brings edge hardware into buildings and homes. PTC closes the loop at the start of the lifecycle: its Creo is used to design complex products, Windchill manages product lifecycle data, Codebeamer manages software and application development, while ServiceMax and Servigistics extend that information into maintenance and aftermarket operations. Across computer-aided design (CAD), product lifecycle management (PLM), application lifecycle management (ALM) and service lifecycle management (SLM), PTC essentially owns the digital record from the moment a product is designed, through how it is manufactured, to how it is operated and maintained.
Combined with Schneider’s existing electrical equipment, processes and energy data, the portfolio now spans everything from “design and build” to “operate and maintain”, creating a contextualized data foundation for industrial AI. The distinction matters as AI applied to an isolated sensor reading can tell an operator, for example, that a machine is overheating, but AI connected to engineering data, product configuration, operating history and maintenance records can begin to explain which configuration is overheating, why, what component is likely responsible and how similar assets have behaved.
From product design to industrial intelligence
Source: Schneider Electric, PTC, InterCapital Research
The parallels with Končar Group are hard to ignore, although its core business is materially different and much closer to grid infrastructure and heavy engineering. Schneider, by contrast, is heavily exposed to energy management, low- and medium-voltage electrical distribution, industrial automation, buildings and data centers, and is increasingly wrapped in a software layer. Still, the underlying industrial cycle is the same: electrification is driving demand for physical equipment in grids, factories and data centers, while digitalization is raising the value of the software attached to it.
Končar, too, has expanded its Digital segment through M&A in recent years – Adnet, Kreanca Sustavi, NEOS – adding capabilities in networking, computing systems, business applications, analytics and cloud platforms. Alongside these acquisitions, it has continued to develop proprietary solutions under the PROZA umbrella, including SCADA-based monitoring and control of energy infrastructure, power-grid system interoperability, urban infrastructure management and data center management. Smart grids are the future, and a fairly near one at that. Končar will not become a software-first company, but a stronger digital offering should let it capture more value around the physical equipment it already knows how to design and manufacture.
A stronger digital layer means more than incremental software revenue. It raises switching costs, deepens the customer relationship after equipment delivery, creates recurring maintenance and service opportunities, and differentiates equipment in a market where manufacturing capacity is expanding.
There is, however, a very physical constraint to this increasingly digital story – no amount of AI can manufacture a transformer without electrical steel and other key inputs. On 25 September, the European Commission imposed provisional safeguard measures on imports of grain-oriented electrical steel (GOES), combining tariff-rate quotas with price thresholds (EUR 2,800–3,400 per ton within quota and EUR 3,500 per ton outside it). The measures also cover laminations, cores and cores already incorporated into imported transformers.
Key transformer input prices (2020=100)
Source: T&D Europe, WB Commodity Markets, InterCapital Research
The Commission's investigation pointed to growing import pressure and global overcapacity, particularly from China. GOES was already subject to anti-dumping measures covering China, Japan, South Korea, Russia and the US, but the existing minimum import prices had become less effective as market prices moved above those thresholds. T&D Europe, the industry association, estimates a transfer of more than EUR 700m a year from EU transformer makers to just two domestic GOES producers, Thyssenkrupp Steel (Germany) and Stalprodukt (Poland).
For Končar, the effect cuts both ways. On the cost side, higher GOES prices will feed directly into transformer costs, and how much of that Končar can pass on depends on two factors: the share of its backlog covered by price-adjustment clauses, and the product mix. GOES accounts for roughly 10–30% of a transformer’s unit cost, and the share is higher in distribution transformers than in power transformers. On the competitive side, covering cores already built into imported transformers closes the most obvious loophole – importing finished units instead of steel – which gives EU-based manufacturers some protection. The near-term result is likely a higher cost floor for the whole European industry rather than a Končar-specific margin hit, with February 2027 now a dated catalyst worth tracking.
The bigger picture is that the industry’s two structural trends are playing out at the same time: the digital content of electrical equipment is rising, and so is the strategic importance of the physical supply chain behind it.
Bitcoin price seems to have bottomed on the announcement that the widely anticipated legislative breakout “the Clarity Act” was convincingly repelled in the Senate with even numerous Republican senators voting against. The bill isn’t dead yet, a motion to reconsider has been filed. But a major industry setback, ironically, paved the way for some impactful rulemaking by the SEC that helped propel the next leg higher in crypto prices across the broader ecosystem. Despite the continued tension in the Middle East and the global bond selloff thriller, the asset class remained incredibly resilient, underpinned by continued BTC and ETH ETF inflows.
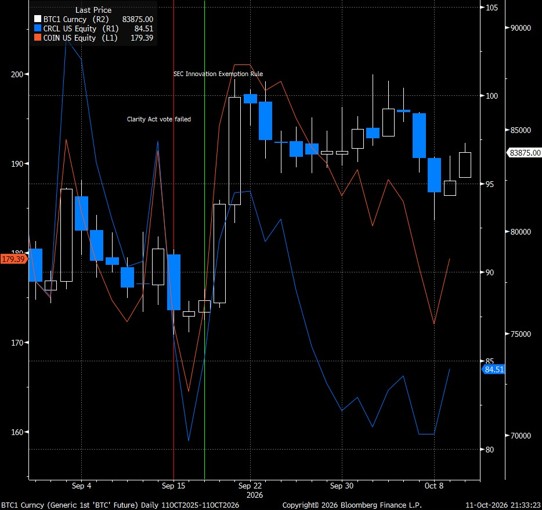
Initially, BTC fell more than 5% as the Clarity Act cloture vote failed (Sep15), with Coinbase and Circle shares (main beneficiaries of the law) dropping by over 10%. BTC price rebounded a day after announcement and kept gains; CRCL rose initially but retraced gains in the following weeks, while COIN remained slightly more buoyed, probably benefitting from steady increase in crypto trading volumes.
Source: Bloomberg, InterCapital
Namely, SEC created an “Innovation Exemption for tokenized stocks” (17Sep) that basically allows companies to facilitate on-chain trading of tokenized versions of listed US stocks, without formal registration as a traditional exchange and allowing some liquidity providers skip formal dealer registrations. This is sort of a win to DeFi (decentralized finance), since the SEC validates DeFi’s core mechanics (proof of concept) for real equities trading; trading settles without a central clearer, meaning trades settle directly against smart contracts (programs) on a public permissionless blockchain (Ethereum for example), with prices set by AMMs (automated market makers) which are basically algorithms that quote prices from the balance of assets in a pool. Liquidity providers deposit both sides of a pair (say, USDC and tokenized Apple) into that pool, earn fees for it and bear the pool’s risks. The catch is that these pools are permissioned, meaning that only approved participants can trade with the pool or supply liquidity to it because the smart contract checks whether your wallet is on an approved list (passing KYC for example). True DeFi doesn’t have gated access to pools, which is important to SEC to enforce AML and investor protection rules. In practice, this is DeFi technology (on-chain settlement, AMM pricing and no central clearer) inside a regulated wrapper, not open DeFi. Of course, an agency order is not a law in terms of robustness, since all rules are reversible, but it shows that regulators are pro-tokenization and pro-institutional access.
This is a 5-year, conditional exemptive relief in which the companies get 30-day notice and can block 3rd party tokenization of their stock; these tokens need to hold the same rights as ordinary underlying shares (dividends, voting); no leverage, no primary issuances, no synthetics and mandatory coordination with primary exchanges; the smart contract used to facilitate the trading needs to be auditable, public and on a permissionless blockchain. Also, SEC posted “Crypto asset FAQs” (Sept25) where they provide staff guidance that helps clarify when a token is or isn’t a security which is important for jurisdiction (SEC or CFTC). But the more important item for institutional flows is “Custody proposal” (Oct1) where SEC proposes letting advisers and registered funds self-custody crypto conditionally. Many tokens, newer blockchains and staking positions have no qualified custodian; the current rules bar RIAs (Registered Investment Advisors) and regulated funds from holding them. Letting advisers hold those assets themselves when no permitted custodian exists removes that automatic exclusion, so regulated money can reach parts of the market it was legally shut out of. However, this rule still faces a 60-day comment period ahead, so realistically, sometime in 2027 this could be enforced, facing the same durability problem that the future SEC could revise it.