
Every options trader knows the term implied volatility. Formally, it’s the number backed out of an option’s price. Intuitively, it’s the future volatility of the underlying that the market price implies, hence the name. The “volatility” part of the name feels just as familiar: the market’s expectation of the annualized standard deviation of future log returns. There are assets, however, where the answer is not that straightforward and intuitive at first. An asset as calm as SOFR can’t possibly have an implied volatility of 14% or more, or can it? This brief, and a little technical, overview has the answer.
Let’s start with what implied volatility actually is to an option pricing model. It is the parameter that makes a particular model reproduce the observed option price. Change the model, and the same price maps to a different number. For assets such as rates and energy, two models matter.
The Black (lognormal) model is the most popular and widely used one. The forward price follows dF = σB · F · dW, so moves are proportional to the level. Without going into the mathematics, here σB is a percentage, measuring moves relative to the current price of the underlying. This is the natural language of equities, where a 2% move means the same thing for a $20 stock and a $2,000 stock. The cost of the model is that F can never reach zero, and the formula is undefined once F or K is negative.
In the Bachelier (normal) model, the forward price follows dF = σN · dW, so moves are additive and independent of the level. Here σN is in the units of the underlying (basis points for rates, dollars per barrel for oil). Zero and negative values cause no difficulty, because the model never takes a logarithm.
What connects them is that at the money (K = F) both option price formulas collapse to almost the same expression, and setting them equal gives us the rule of thumb σN ≈ σB · F. In other words, normal vol (as in implied volatility) is Black vol multiplied by the level. Away from the money, a better approximation replaces F with √(F · K). For anything precise, the two prices have to be equated numerically, because the models imply different smiles.
Back to the SOFR puzzle. A SOFR future is quoted as 100 minus the rate, so a 1bp move in the rate is exactly a 1bp move in the price, and the normal vol of the price and of the rate are the same number. If we check the option monitor for SOFR, we can see an ATM vol of around 14. That can’t be Black vol on the price, which for a price near 96 would be well under 1%. Nor can it be normal vol, as 14bp a year would be implausibly calm for SOFR, and backing the vol out of the option prices confirms it. It is Black vol on the rate. Multiplying by the 4.145% rate gives a normal vol of about 0.58%, or 58bp, and dividing that by the price of 95.855 gives a Black vol on the price of about 0.6%. All three are correct and describe the same option, but the most practical one to work with is the normal one, because it speaks the desk’s language: the implied move in basis points of both price and rate. That is 58bp a year, or, divided by √252 ≈ 16, a daily implied move of roughly 3.6bp.
Another good example, especially after the negative prices in 2020, is crude oil. Additionally, at the current price near $100, implied absolute and percentage moves are almost identical at the money. This gives us a unique opportunity to analyse the similarities and differences between the two implied volatility numbers.
As we can see in the figures below, one showing Black and one normal vols, the wings tell them apart. The 107.5 call shows 55.6% under Black but 57.8 under normal. Similarly, the 93.5 call shows 54.9% under Black but 53.2 under normal. Both chains show the same option premiums, so the upward tilt in normal vol is not the market paying more for calls. Beware of reading call skew from the normal vol curve. Each model reads an OTM strike against its own baseline and vol unit. Black asks what percentage vol the price implies, so a flat Black smile means the market sees moves as proportional to the level. Normal, on the other hand, asks what dollar vol the price implies, so a flat normal smile means moves of the same dollar size wherever the price goes. Proportional moves are larger in dollar size at higher strikes, so a flat Black smile shows up as rising normal vol, an apparent call skew in the normal smile. Skew is therefore a departure from the model’s own assumption, not an absolute property of the market.
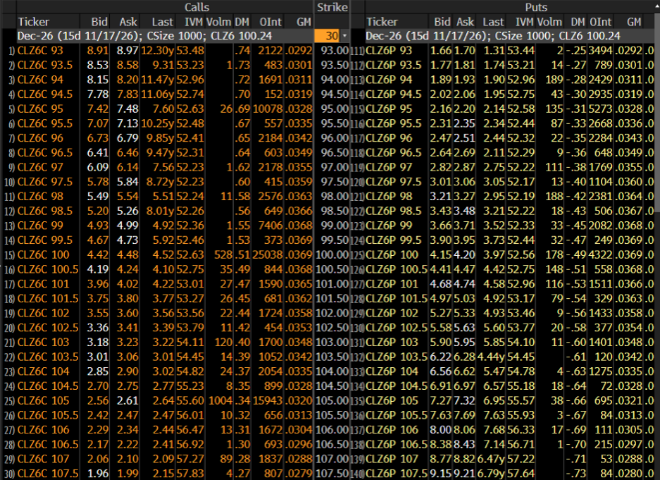
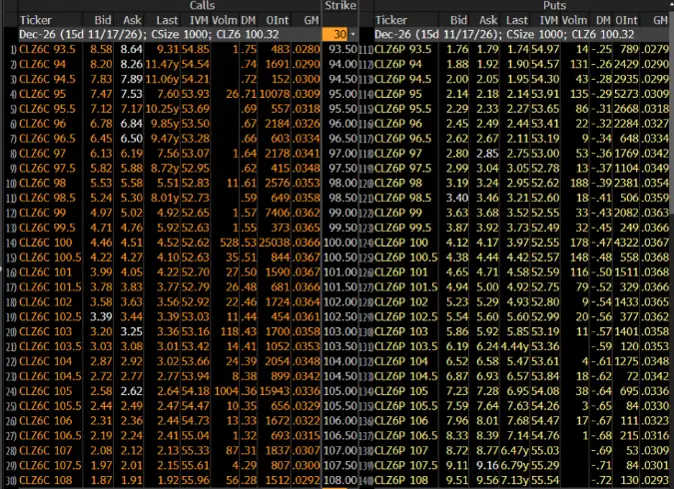
Crude oil option chains with Black and normal vol units (Bloomberg)
To conclude, each quote answers a different question. Black vol asks how large moves are relative to the current level, which is the right question when moves scale with price. Normal vol asks how many basis points or dollars the underlying moves, which is the right question when moves don’t care about the level: rates, spreads, and anything that can approach or cross zero. During the negative-rate years, much of the EUR market kept Black but shifted it, a compromise between the two. Black on a rate is the odd one out. Its meaning drifts with the rate level, so 14% at a 4% rate and 14% at a 1% rate describe very different markets.
The practical rule is simple. Before comparing two vols, check which model and which underlying produced them, and quote in the units your risk is measured in. Both implied volatilities show the same uncertainty, measured with a different ruler.